
Linux Commands
Hardware and Device Commands
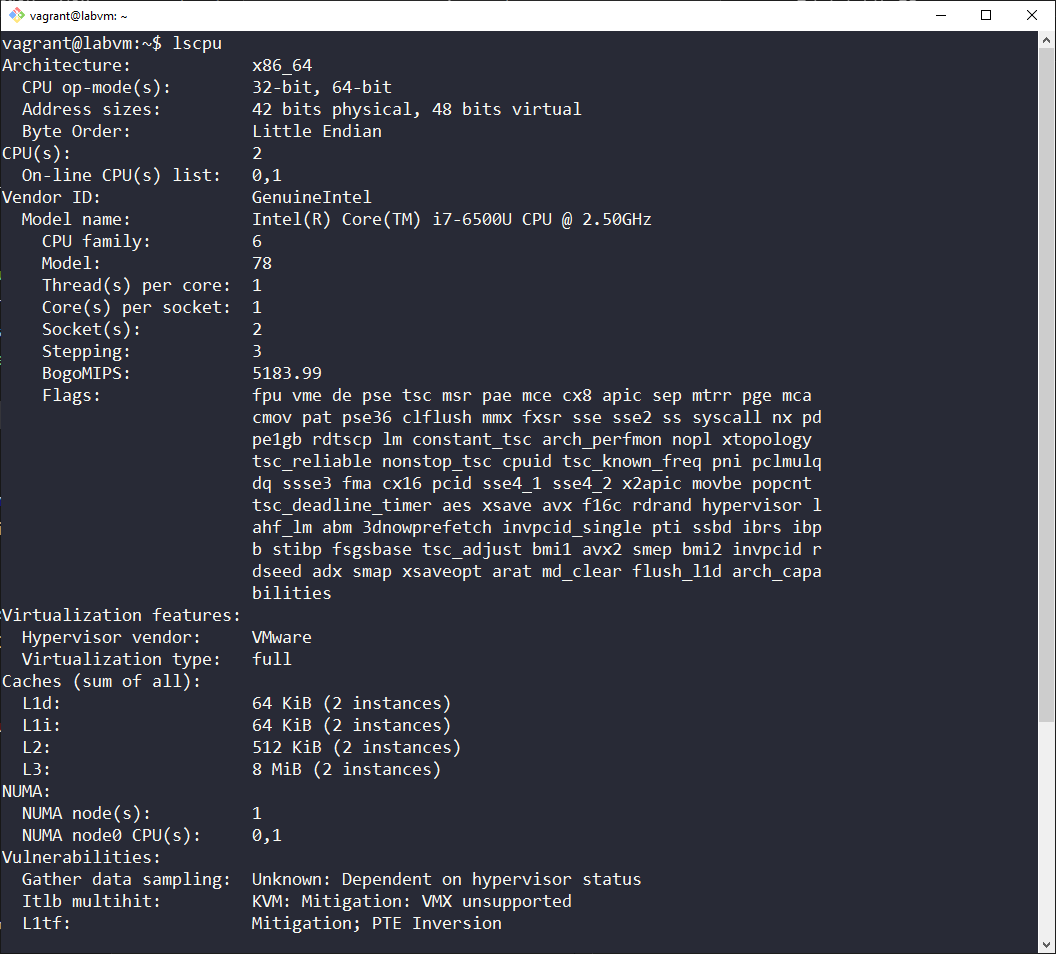
1. Command: lscpu
Description: Provides details about the CPU, such as number and speed of each socket and core.
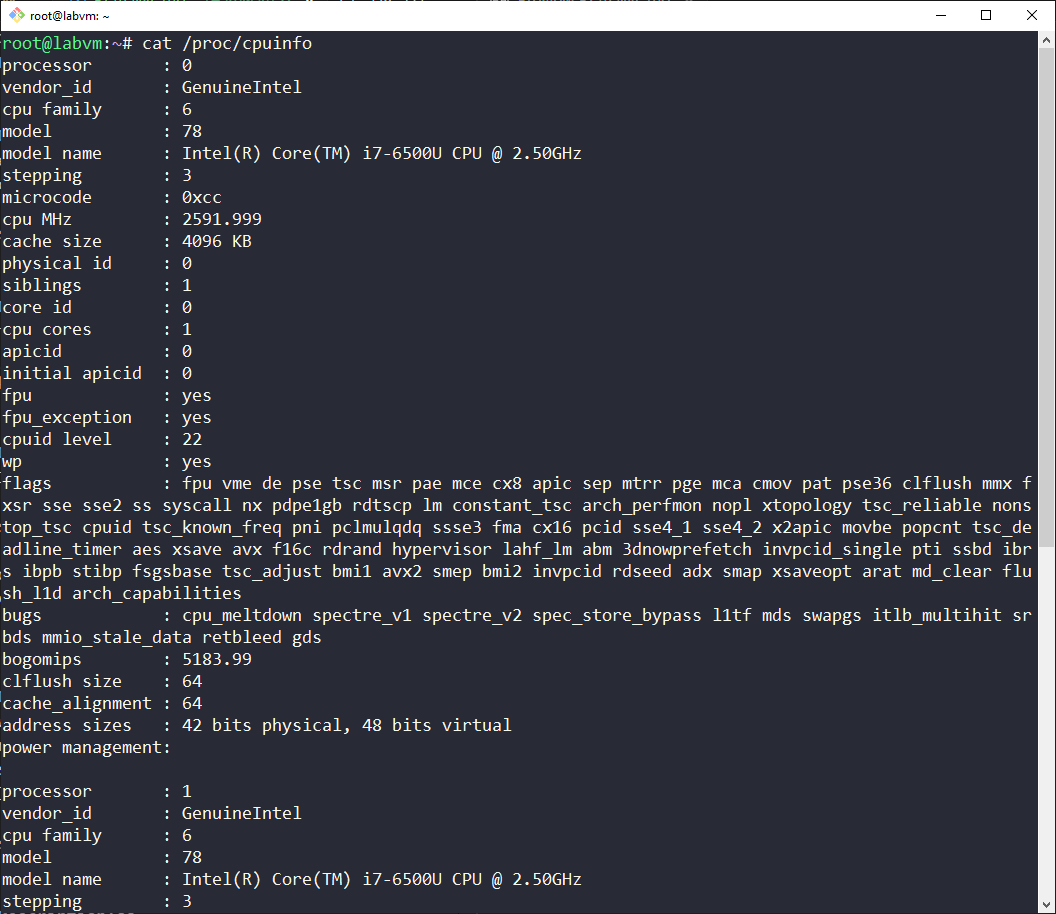
2. Command: cat /proc/cpuinfo
Description: Provides detailed information about the CPU.
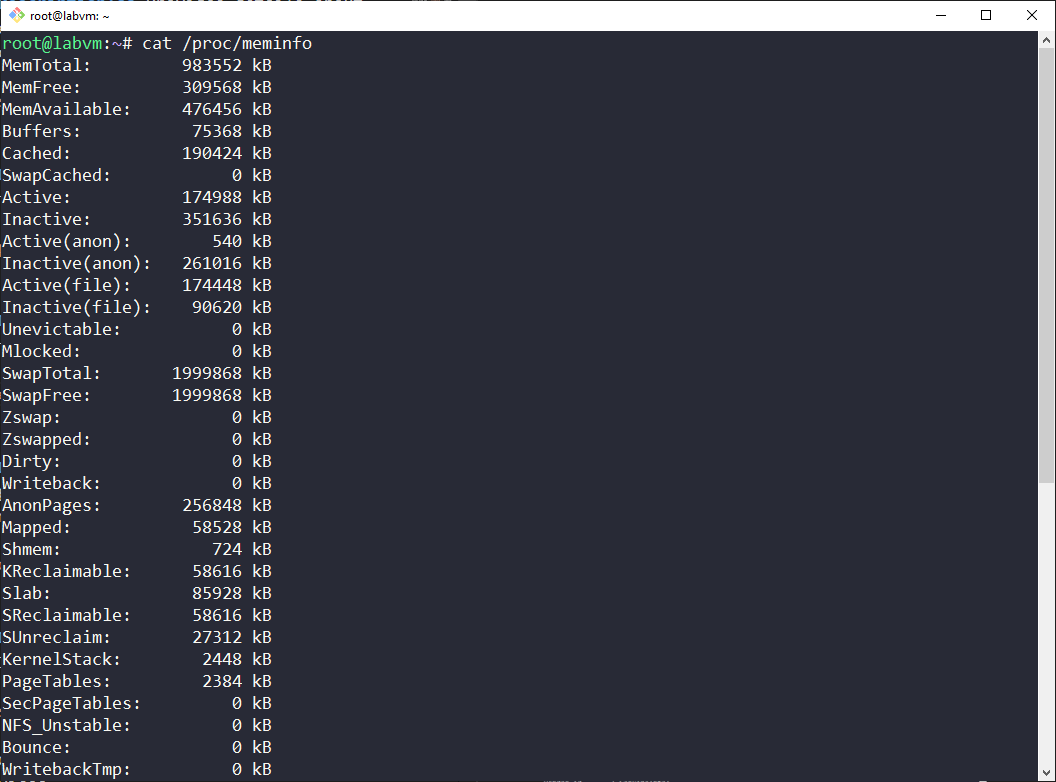
3. Command: cat /proc/meminfo
Description: Provides detailed information about the memory.
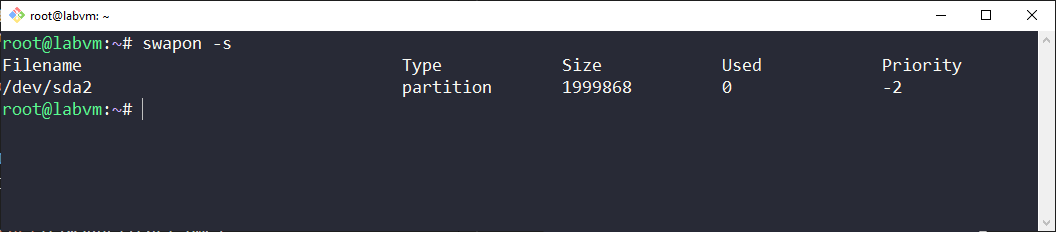
4. Command: swapon -s
Description: The swapon -s command in Linux is used to display information about all the swap spaces currently in use. When you run this command, it provides details such as the filename, type, size, used space, and priority of each swap area.
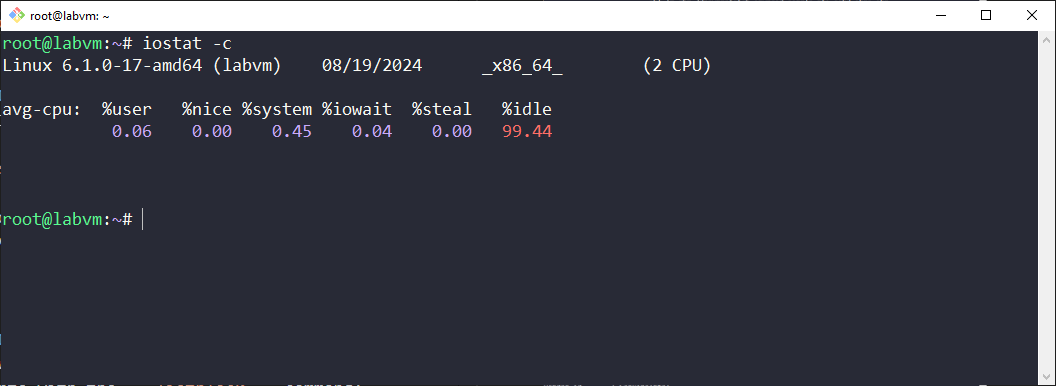
5. Command: iostat -c
Description: Provides statistics regarding CPU utilization since the last time the system was booted.
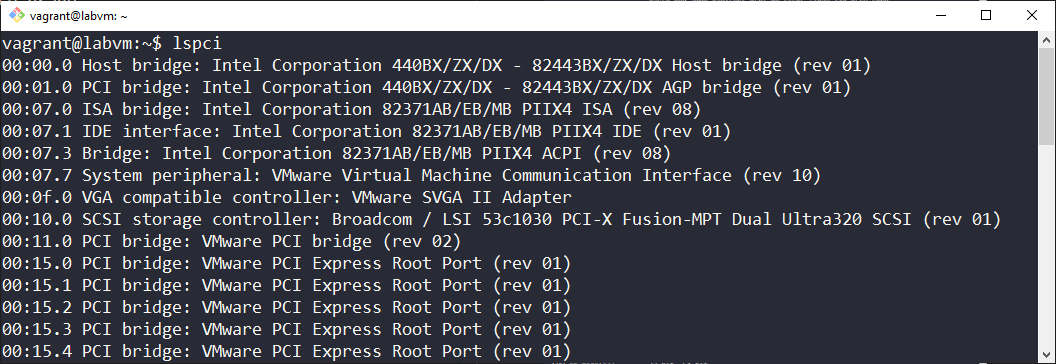
6. Command: lspci
Description: Provides details about PCI bus and devices.
Provides details about PCI bus and devices.
7. Command: lsblk
Description:
view disks, their partitions, and mount points with the listblock command:
lsblk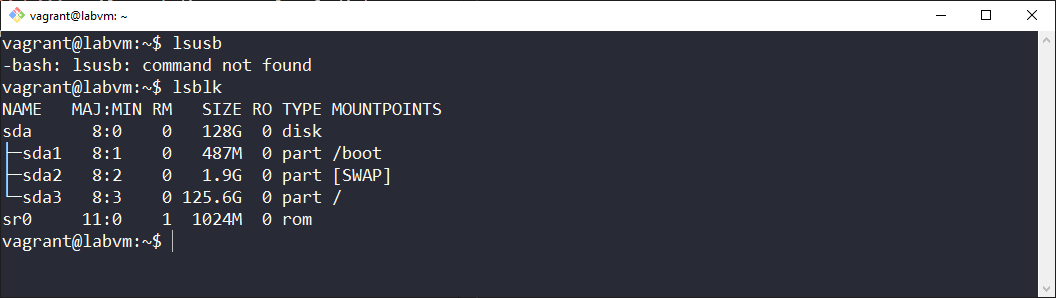
8. Command: dmesg
Description: Displays the “Kernel Ring Buffer”, collection of messages created during the boot process. Great tool for determinig what devices were recognized by the system during booting:
dmesg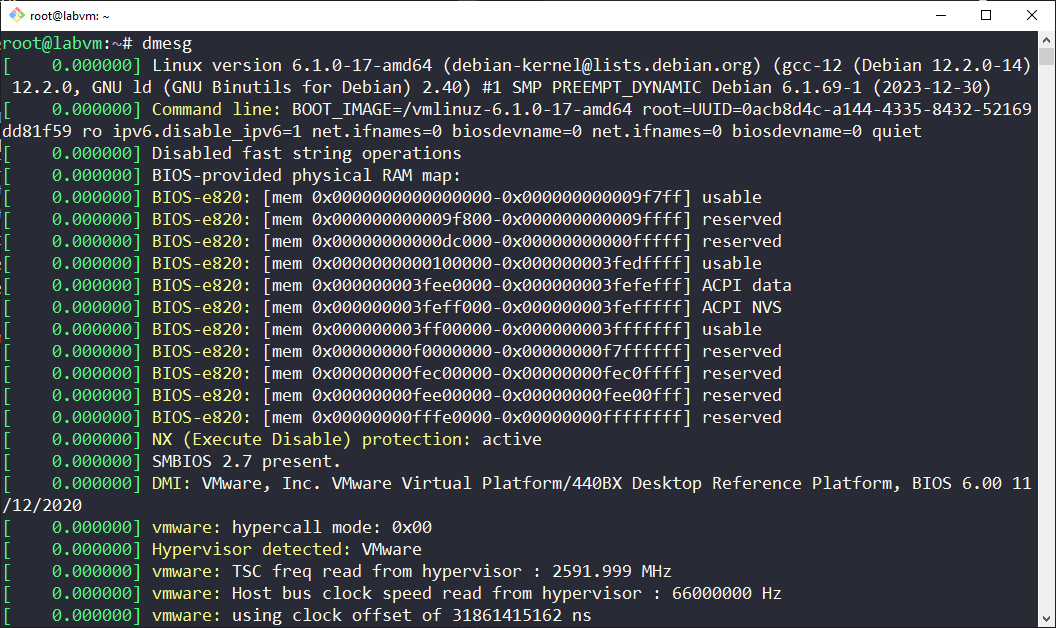
9. Command: uptime
Description: Displays how long the system has been runing, how many users are on the system and system load average over the most recent 1, 5, and 15 minutes:
uptime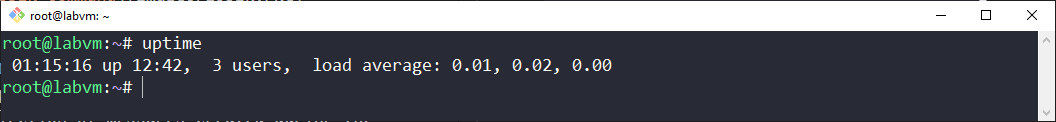
Networking Commands
Basic Commands
1. Command: ifconfig
- Description: Displays network interface parameters like name, ip address.
- Syntax:
ifconfig [interface] [options] - Example Syntax:
ifconfig eth0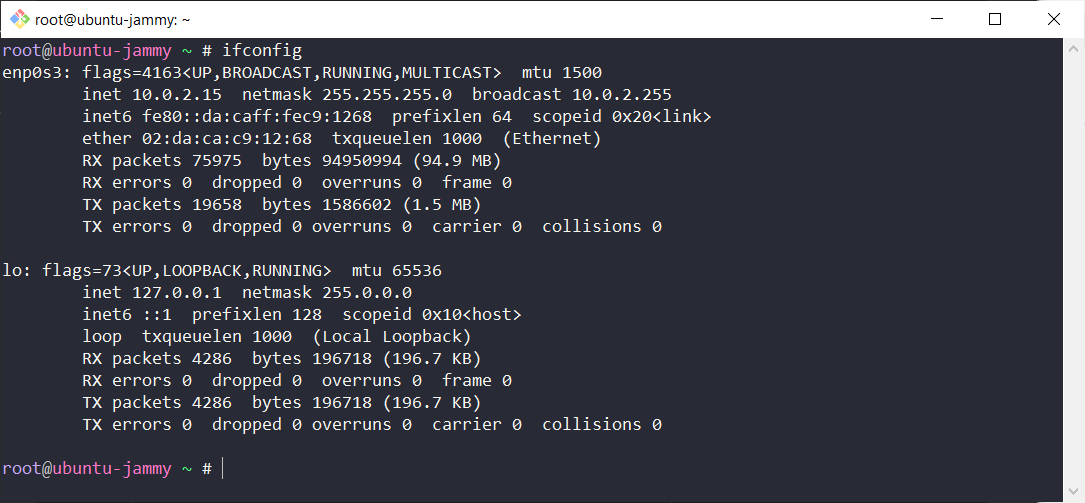 Note:
Note: ifconfig command is deprecated and not available in the latest Debian versions. Use ip command instead.
2. Command: ip
- Description: Shows/manipulates routing, devices, policy routing, and tunnels.
- Syntax:
ip [options] <object> [command] - Example Syntax:
ip addr show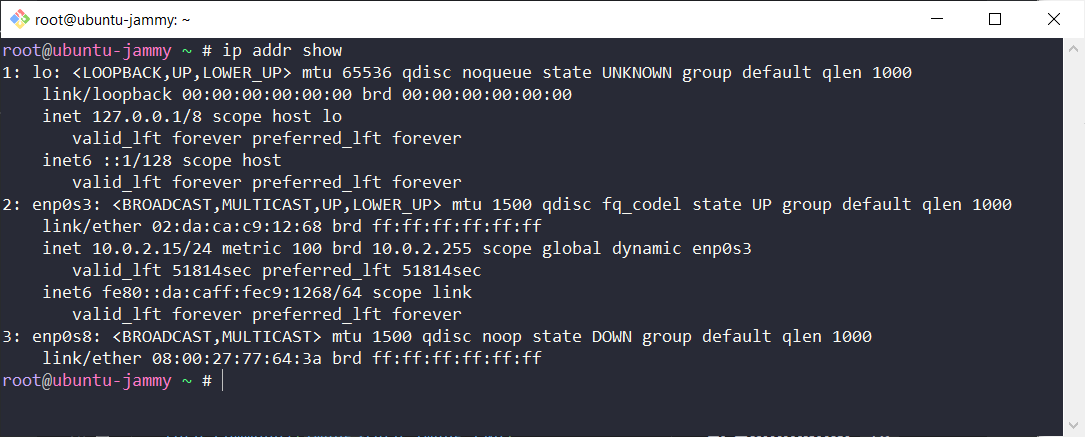
3. Command: arp
- Description: Displays or modifies Kernel’s ARP table cache, IP => MAC Address Mapping.
- Syntax:
arp [options] [hostname] - Example Syntax:
arp -a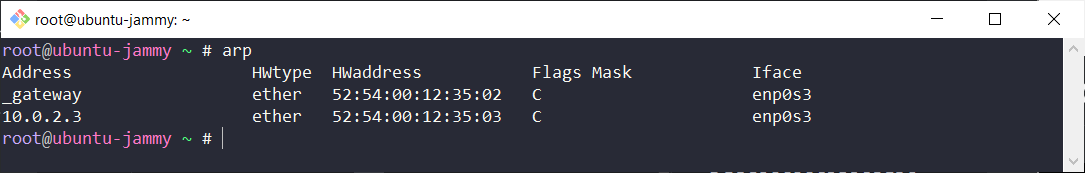
4. Command: hostname
- Description: Displays or sets the system’s hostname.
- Syntax:
hostname [options] [new_name] - Example Syntax:
hostname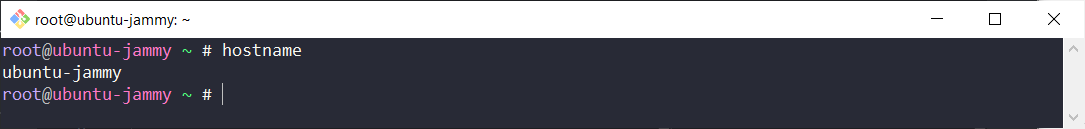
5. Command: curl
- Description: Transfers data from or to a server through terminal like getting HTML content.
- Syntax:
curl [options] <url> - Example Syntax:
curl http://example.com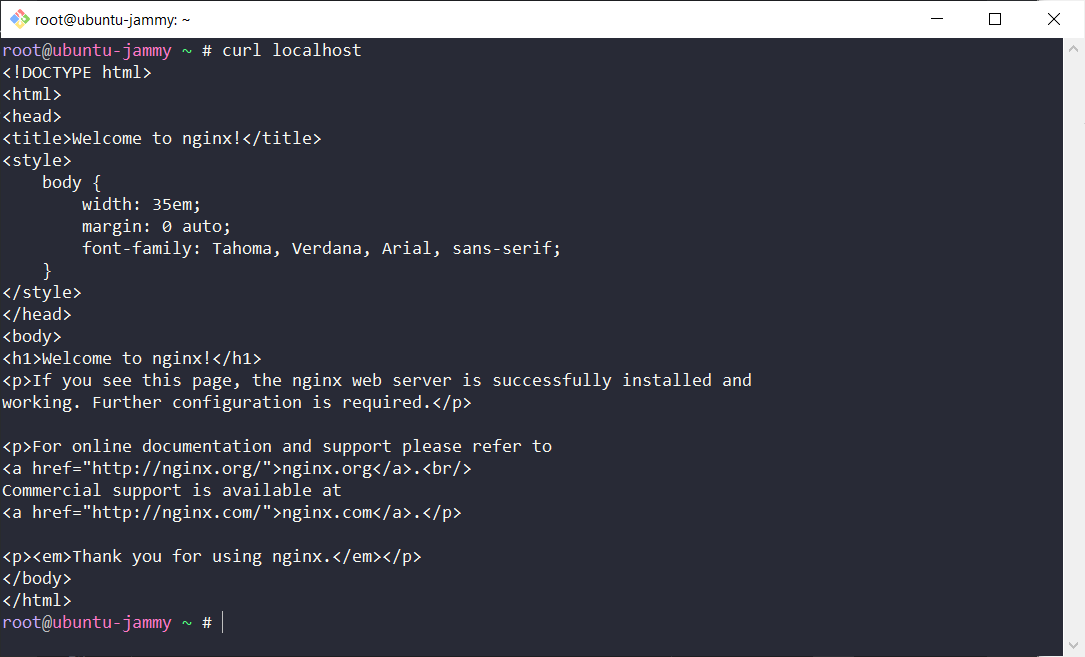
6. Command: wget
- Description: Downloads files from the web using HTTP, HTTPS, or FTP protocols.
- Metrics: Download Speed, Download Status
- Syntax:
wget [options] <url> - Example Syntax:
wget https://example.com/file.txt 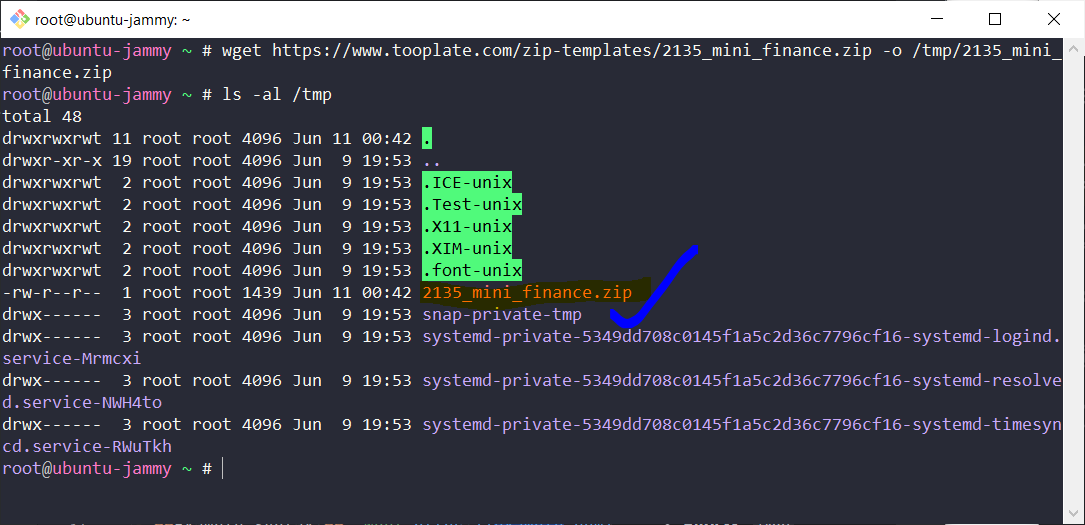
Advanced Commands
1. ping
- Description: Measures round-trip time (RTT) and packet loss.
- Metrics: Latency (RTT), Packet Loss
- Syntax:
ping [destination] - Example Syntax:
ping google.com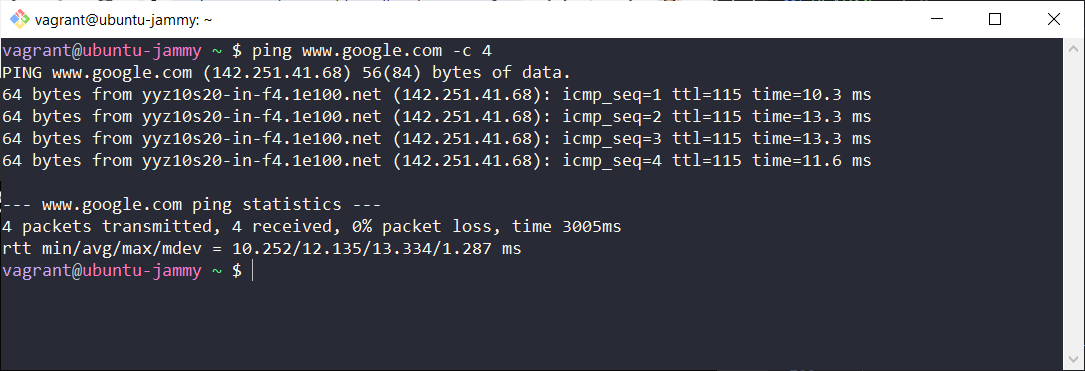 Note:
Note: By default, ping command sends 4 packets in WINDOWS OS and unlimited packets unless specified in LINUX/UNIX machine.
2. traceroute (Windows: tracert, Unix/Linux: traceroute)
- Description: Trace the path taken by packets (3 by default) to reach a destination, showing each hop’s latency/RTT.
- Metrics: Latency per hop, Path analysis
- Syntax:
traceroute [destination]ortracert [destination] - Example Syntax:
traceroute google.comortracert google.com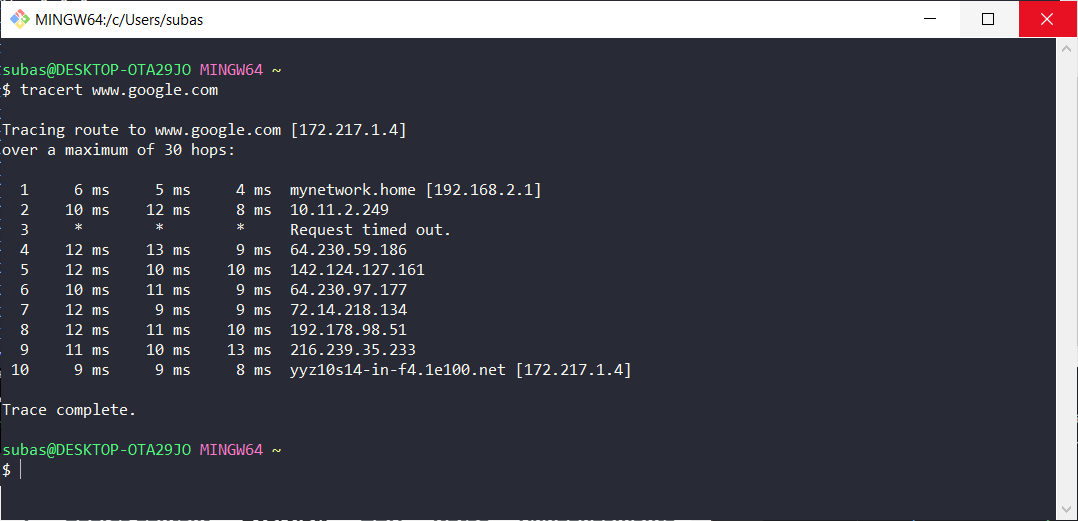
- Note:
* represents bottleneck or router not configured to send information but it passes to another router
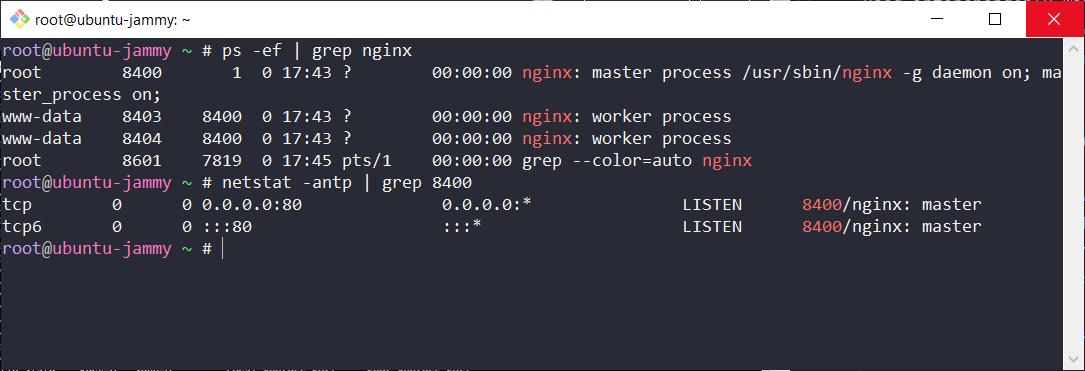
3. netstat
- Description: Displays network connections, services/processes(PID) and the ports they are using.
- Used interchangeably with
ps -ef | grep PIDto map PID, name and Port number. - netstat -antp -
ProcessId, Process Name, Port, ps -ef -ProcessId, Process Name - Metrics: Network Connections, Interface Statistics
- Syntax:
netstat -antpa - all (Established/Listening), n - numberic (dont resolve names), t - tcp, p - programs (display programs ID using port/socket) - Example Syntax:
netstat -antp
4. ss -tunlp
- Description: Displays display detailed information about socket connections. Each option in the command stands for a specific type of connection information.
t: TCP socketsu: UDP socketsn: Show numerical addresses instead of resolving hostnamesl: Show only listening socketsp: Show process using the socket- Used as combination of
netstat -antpandps -efgivePID,Process NameandPort Numberin one command. - netstat -antp -
ProcessId, Process Name, Port, ps -ef -ProcessId, Process Name - Metrics: Network Connections, Interface Statistics
- Example Syntax:
ss -tunlp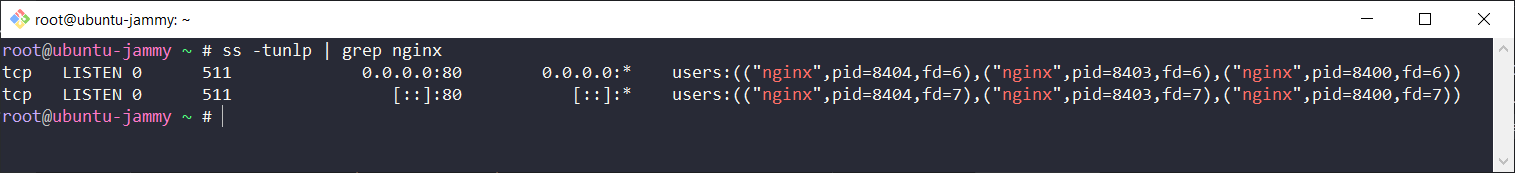
11. nmap
ILLEGAL TO SCAN OTHER NETWORKS WITHOUT AUTHORIZATION- Description: Scans networks to discover hosts, ports, and services, providing detailed information about each.
- Metrics: Host Discovery, Port Scanning, Service Detection
- Syntax:
nmap [options] [targets] - Example Syntax:
nmap -sP 192.168.1.0/24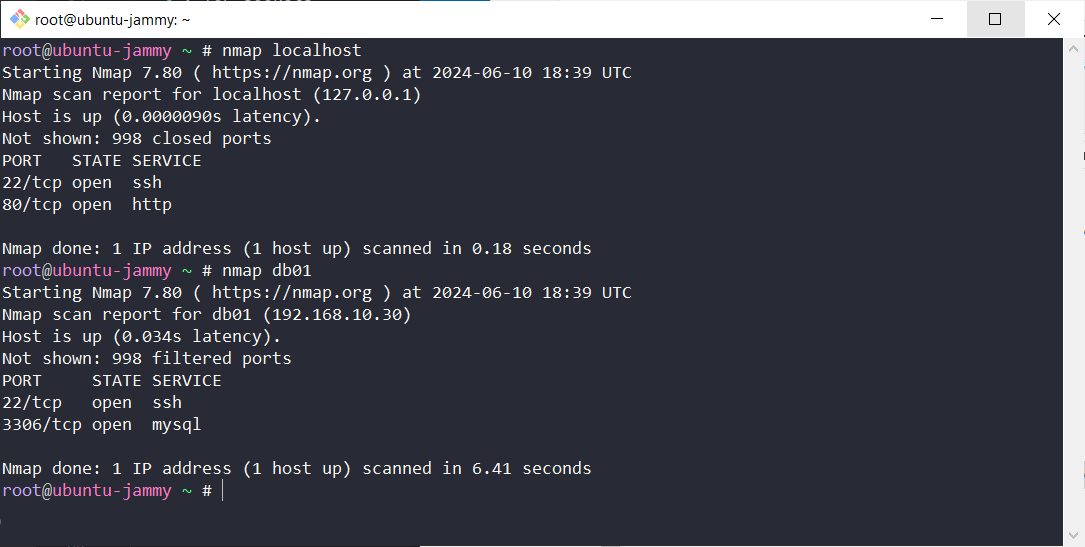 Note: Example includes scanning my local hosts like
 localhostandDatabase(db01)to avoid doing ILLEGAL activity.
12. nslookup/dig
- Description: Queries DNS servers to obtain domain name or IP address mapping.
- Metrics: DNS Resolution Time
- Syntax:
- Nslookup:
nslookup [domain] - Dig:
dig [domain]
- Nslookup:
- Example Syntax:
- Nslookup:
nslookup google.com - Dig:
dig google.com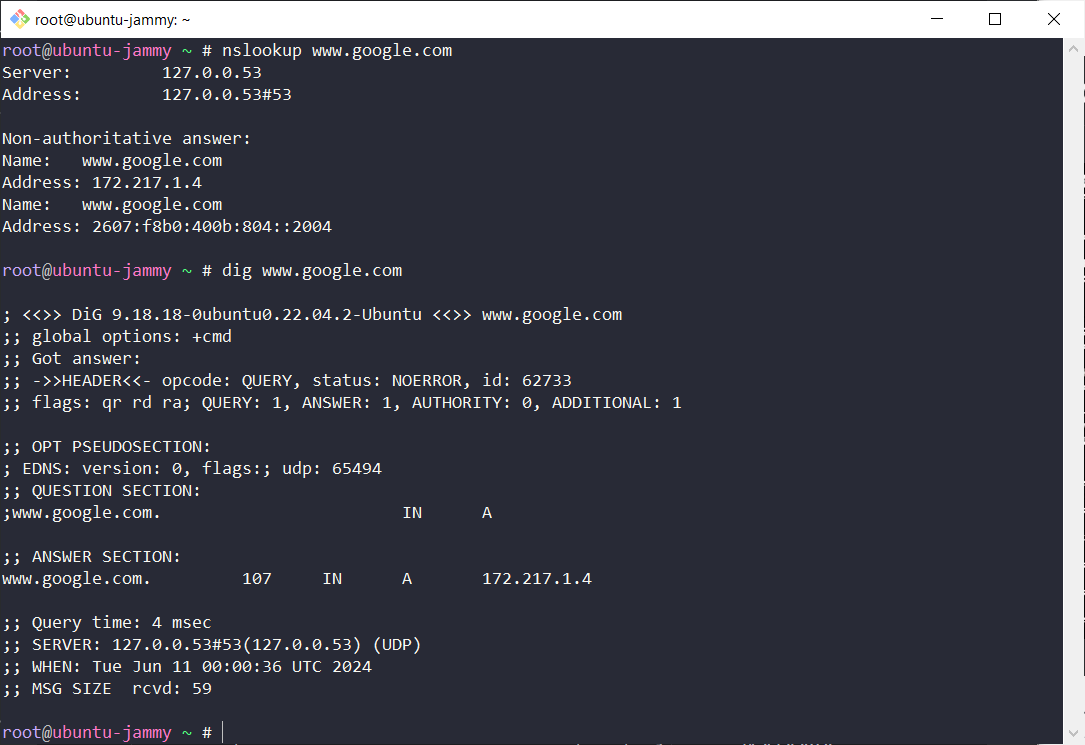 Note: DIG IS NEWER VERSION OF NSLOOKUP
- Nslookup:
13. route -n
- Description: Display
GATEWAYSand routing table Displays IP routing table in numeric format, bypassing host name resolution. - Metrics: Routing Table Entries, Gateway
- Syntax:
route -n - Example Syntax:
route -n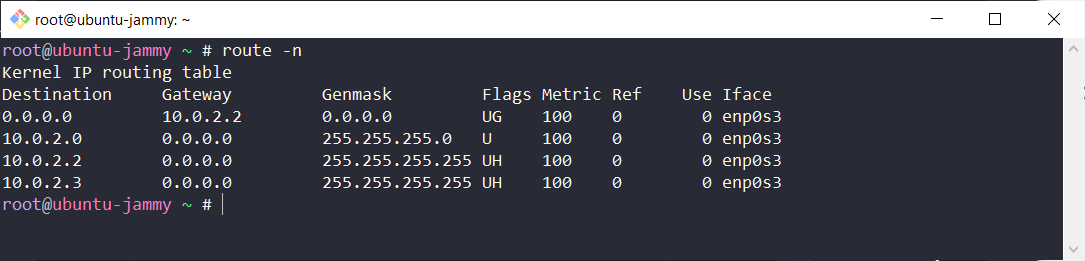
14. mtr (My Traceroute)
- Description: Combines the functionality of ping and traceroute, providing continuous/LIVE network diagnostic information.
- Metrics: Latency, Packet Loss, Jitter, Path analysis
- Syntax:
mtr [destination] - Example Syntax:
mtr google.com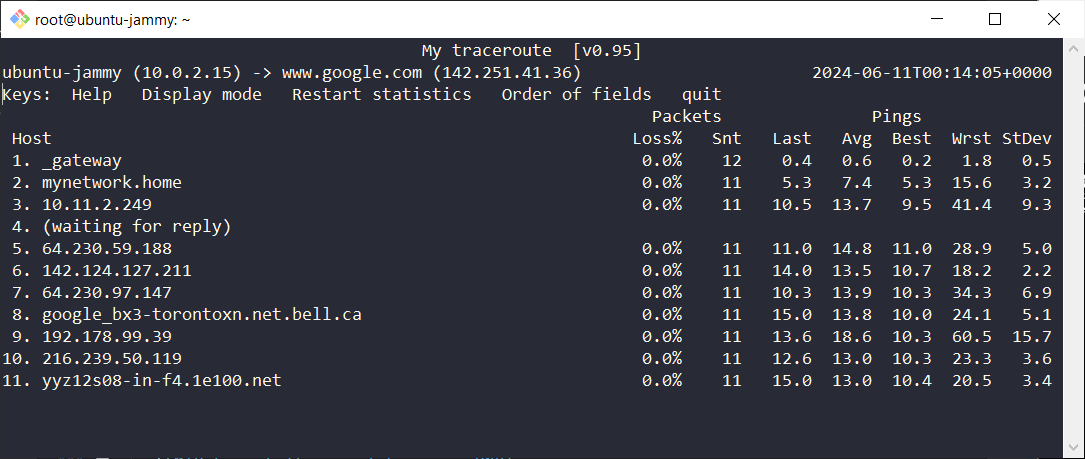
15. telnet
- Description: Used to whether particular hostname/IP as well as
PORTis open in target machine or not. - Syntax:
telnet [hostname or IP address] [port] - Example Syntax:
telnet google.com 80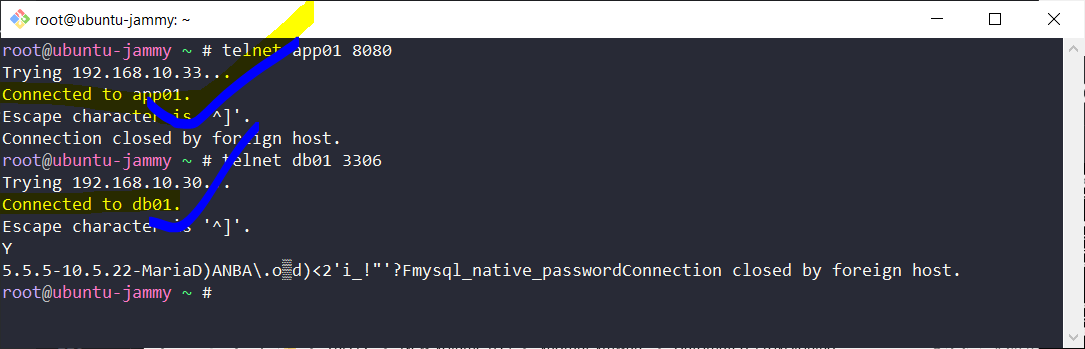
- Metrics: Connection Status:, Response Time:*
15. tcpdump/Wireshark
- Description: Captures and analyzes network packets for detailed diagnostics.
- Metrics: Packet Analysis, Latency, Bandwidth Usage, Jitter
- Syntax:
- Tcpdump:
tcpdump -i [interface] - Wireshark: Use the graphical interface to start capturing packets.
- Tcpdump:
- Example Syntax:
- Tcpdump:
tcpdump -i eth0 - Wireshark: Open Wireshark and click “Start Capturing”
- Tcpdump:
16. Command: iperf/iperf3
- Description: Measures network bandwidth (throughput) between two hosts.
- Metrics: Bandwidth (Throughput), Latency (with -u option for UDP)
- Syntax:
- Server:
iperf3 -s - Client:
iperf3 -c [server_ip]
- Server:
- Example Syntax:
- Server:
iperf3 -s - Client:
iperf3 -c 192.168.1.1
- Server:
17. speedtest
- Description: Measures internet connection speed (upload and download bandwidth).
- Metrics: Download Speed, Upload Speed, Latency
- Syntax:
speedtest - Example Syntax:
speedtest
18. pathping (Windows)
- Description: Combines the functionality of ping and traceroute, providing detailed analysis of each hop.
- Metrics: Latency, Packet Loss per hop, Path analysis
- Syntax:
pathping [destination] - Example Syntax:
pathping google.com
Storage Commands
Comparison of fdisk, df, du in Linux
fdisk: Disk partition structure and information.df: Filesystem level disk space usage.du: File and directory level disk space usage.
Using fdisk Utility in Linux
The fdisk command is a powerful utility for disk partitioning in Linux. It allows us to view, create, delete, and manage disk partitions on a hard drive. Here’s how we can use fdisk with various commands:
Steps for Creating an EBS Volume and Mounting it in an Existing EC2 Instance
1. List Available Disks
sudo fdisk -l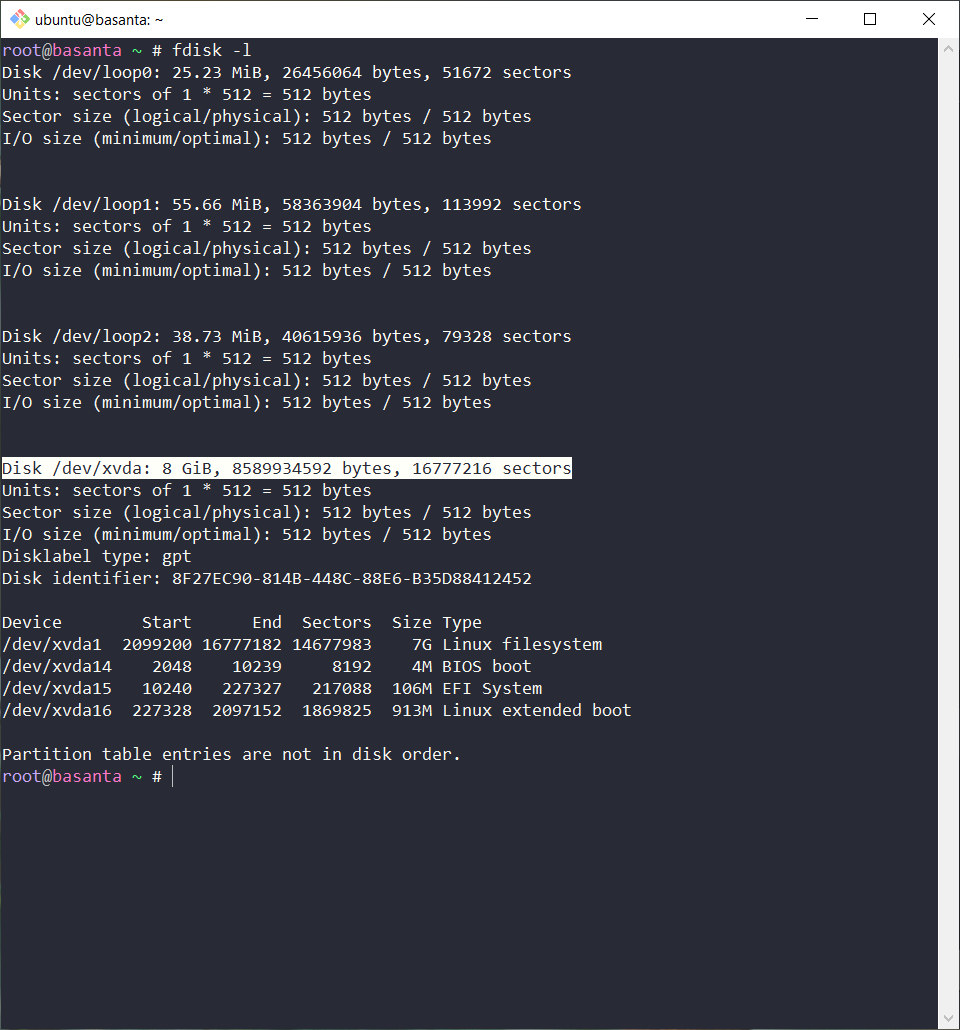
To view where the partition is mounted:
df -h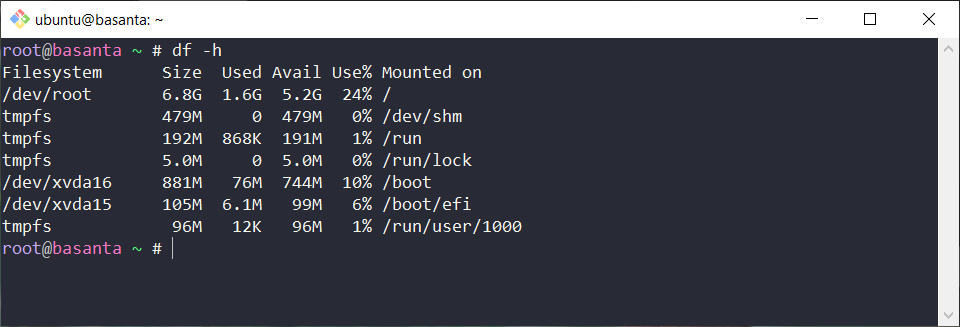
Alternatively, you can view disks, their partitions, and mount points with the listblock command. It is similar to fdisk -l:
lsblk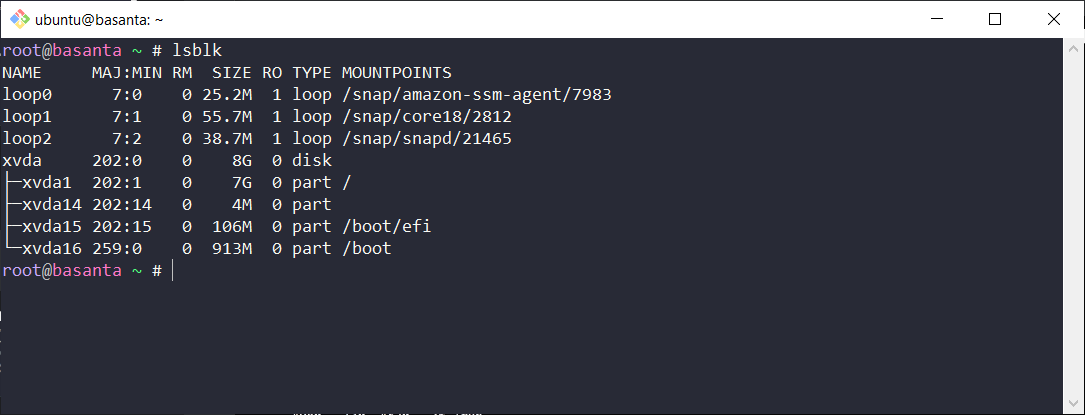
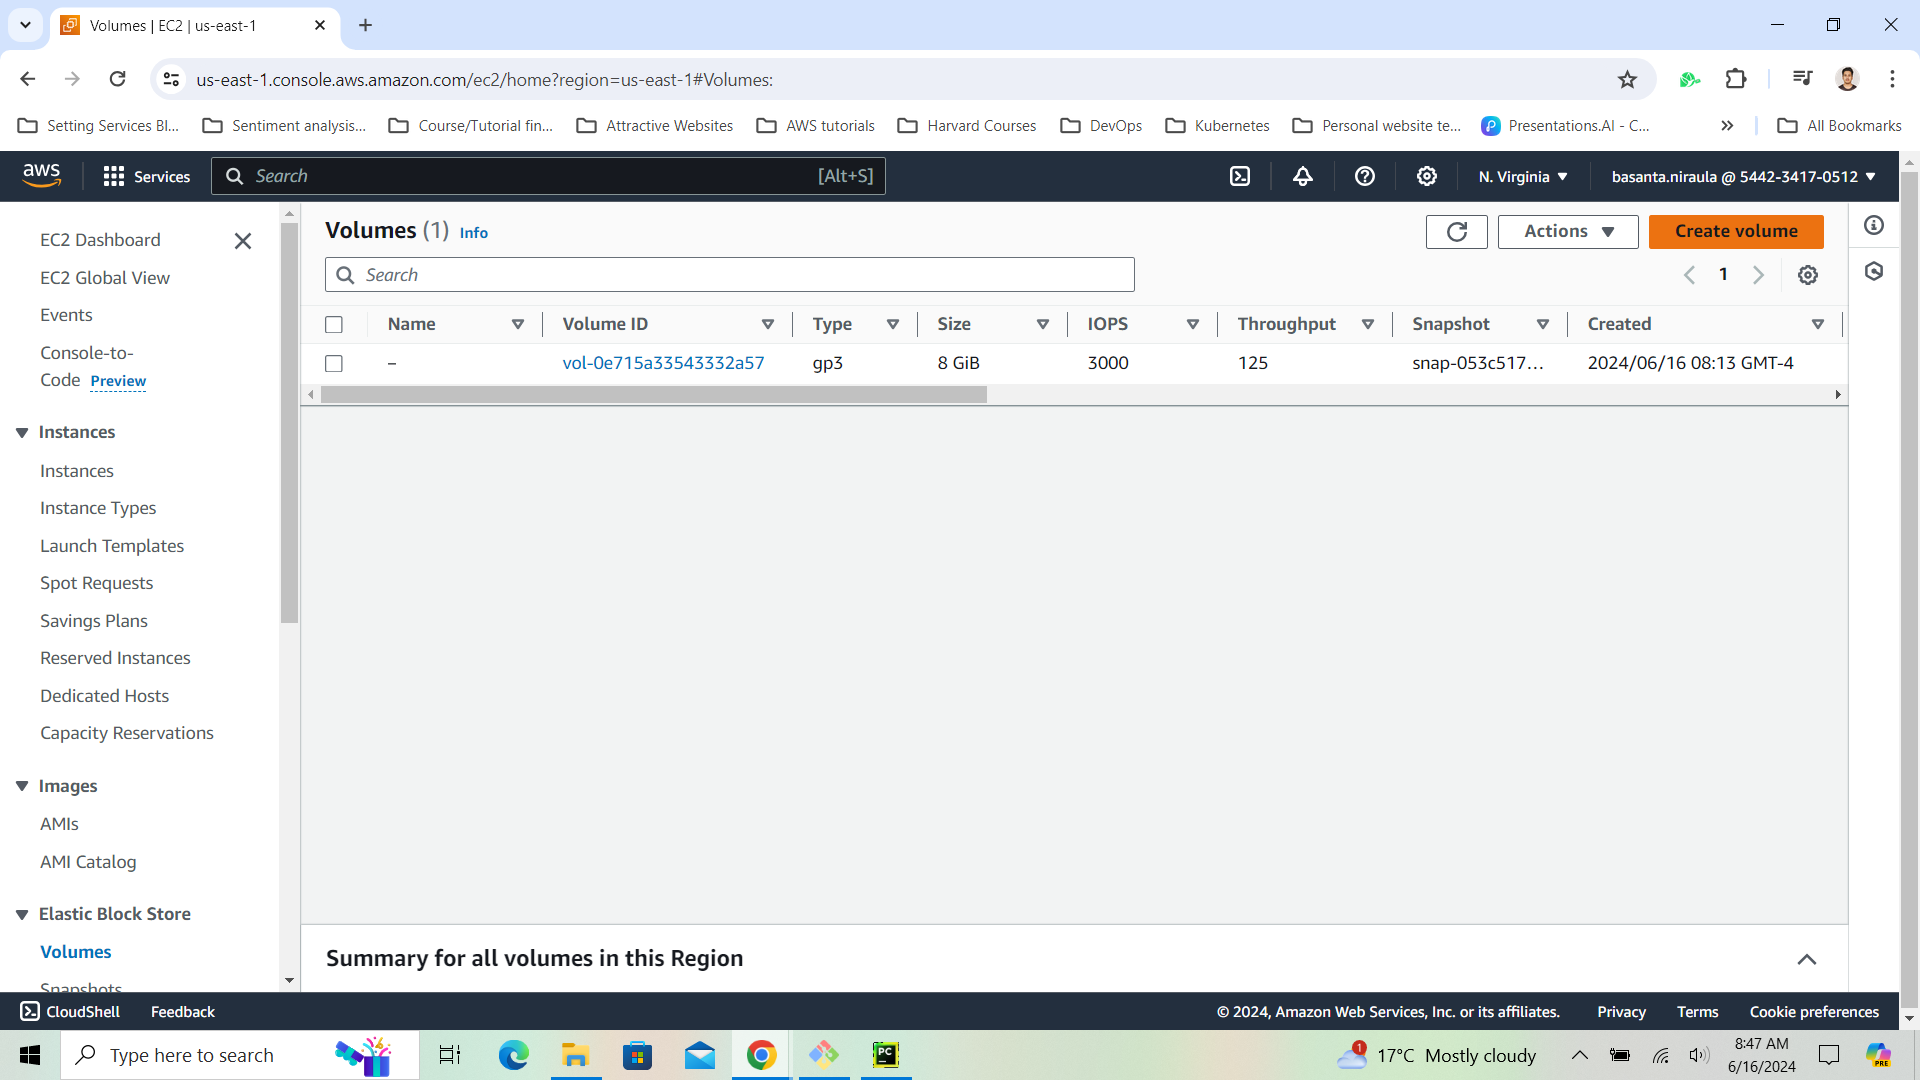
2. Create an EBS Volume and Attach it to an Existing EC2 Instance
-
Under the Volumes menu, go to “Create Volume”:
-
In the Create Volume wizard, select the same Availability Zone (AZ) as your EC2 instance:
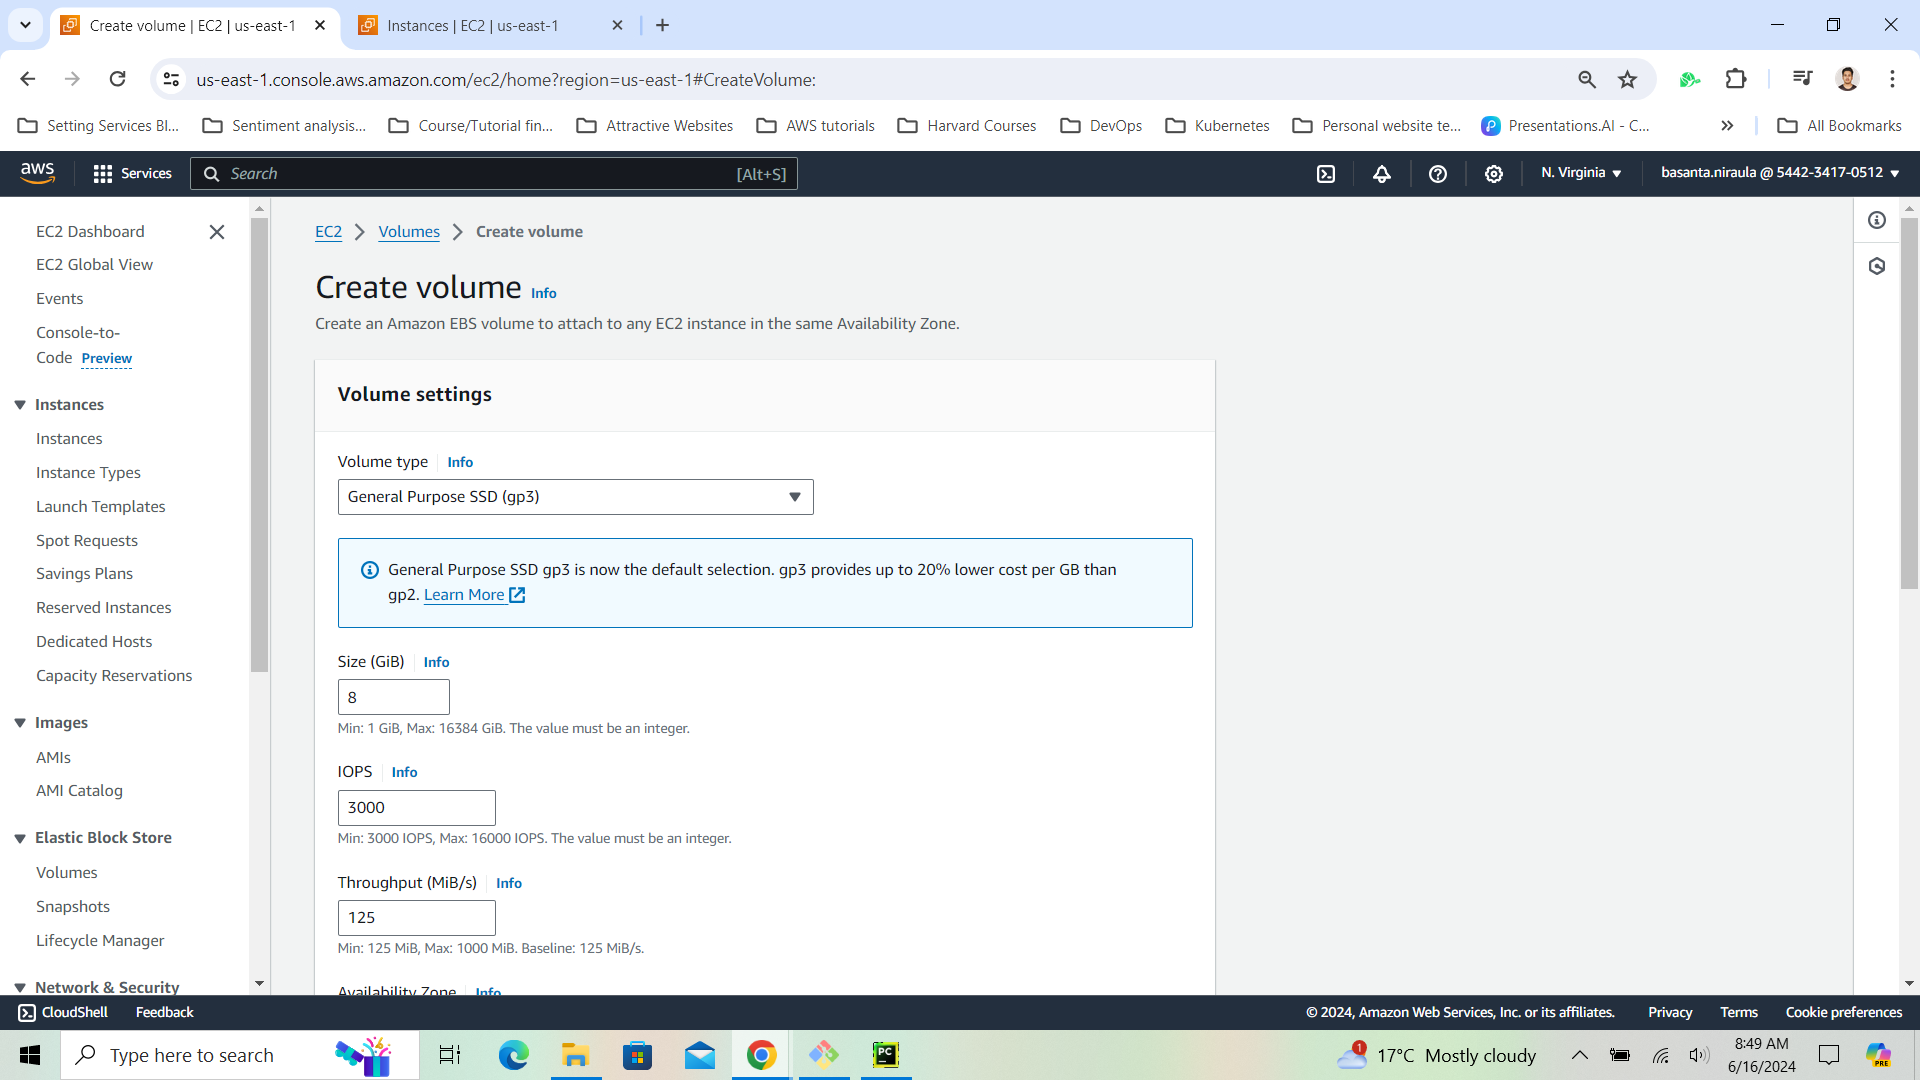
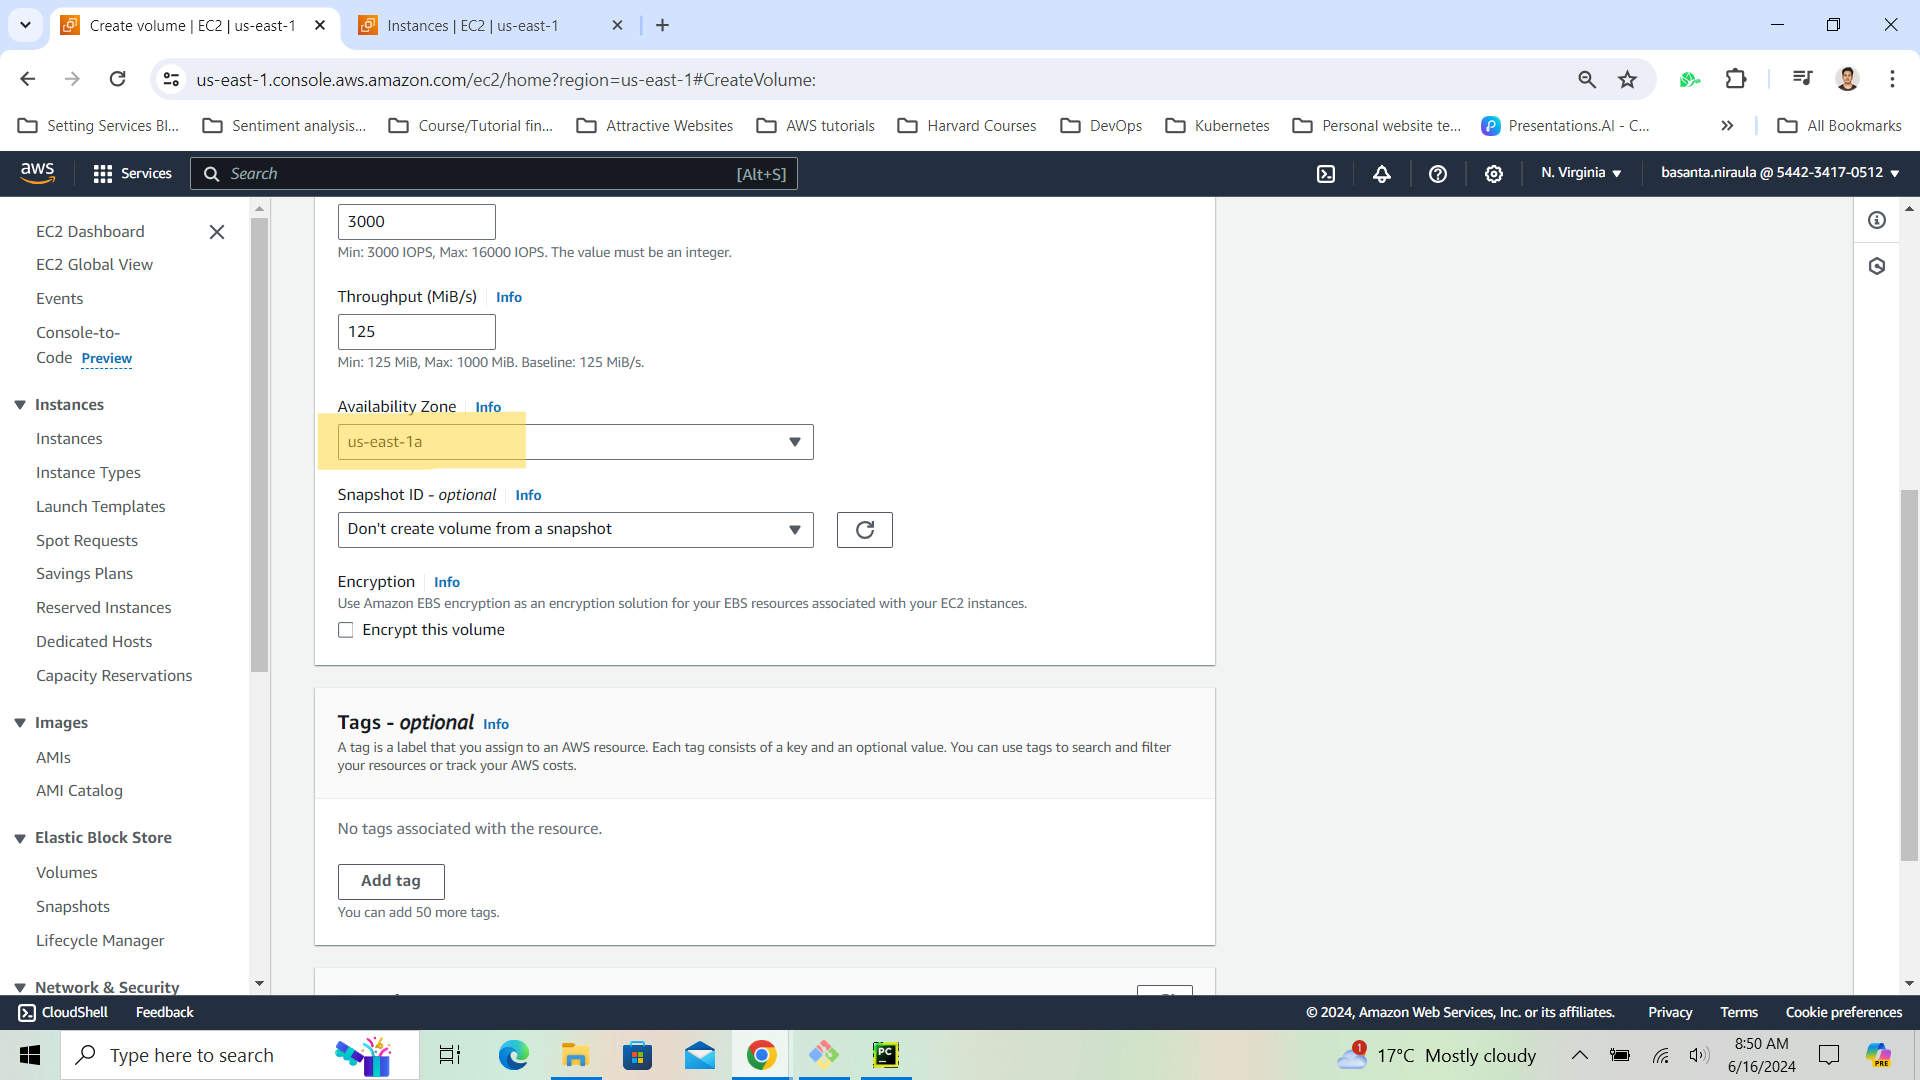
-
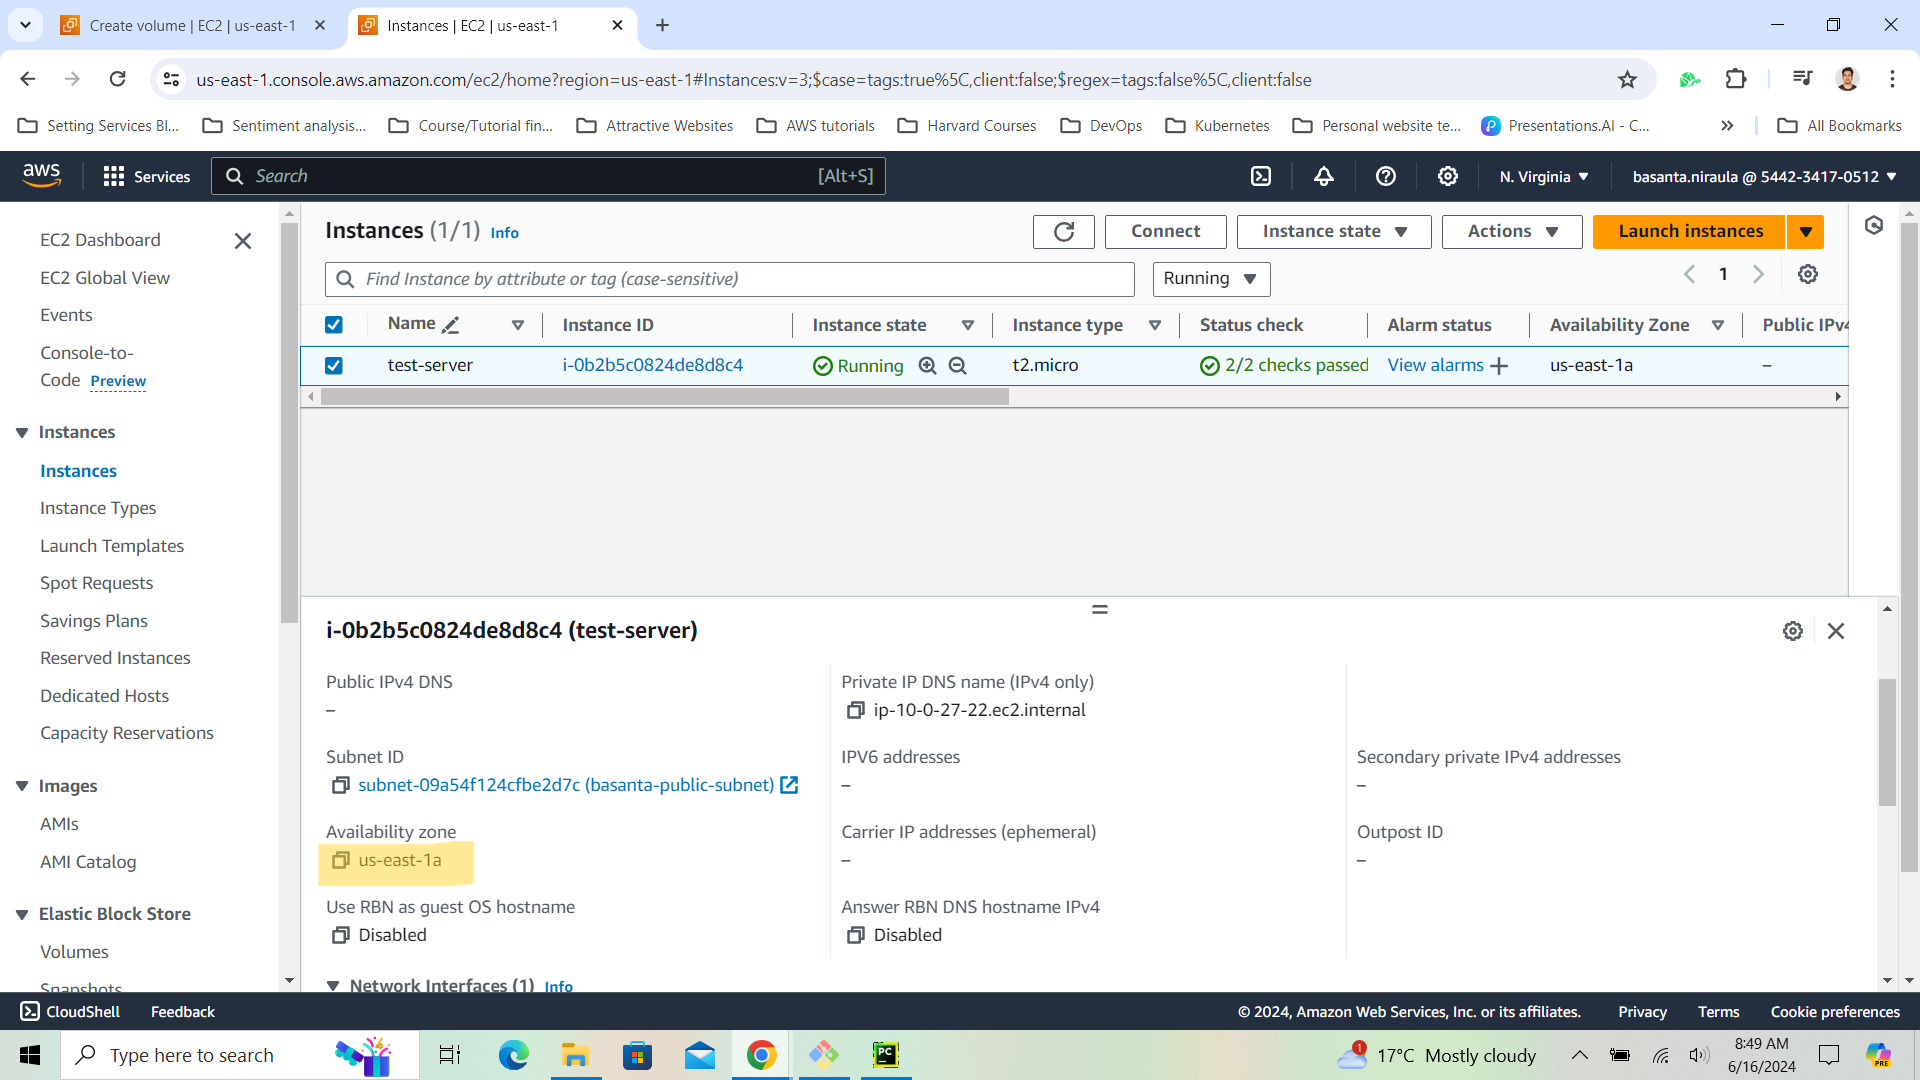
Attach the Volume to your EC2 instance:
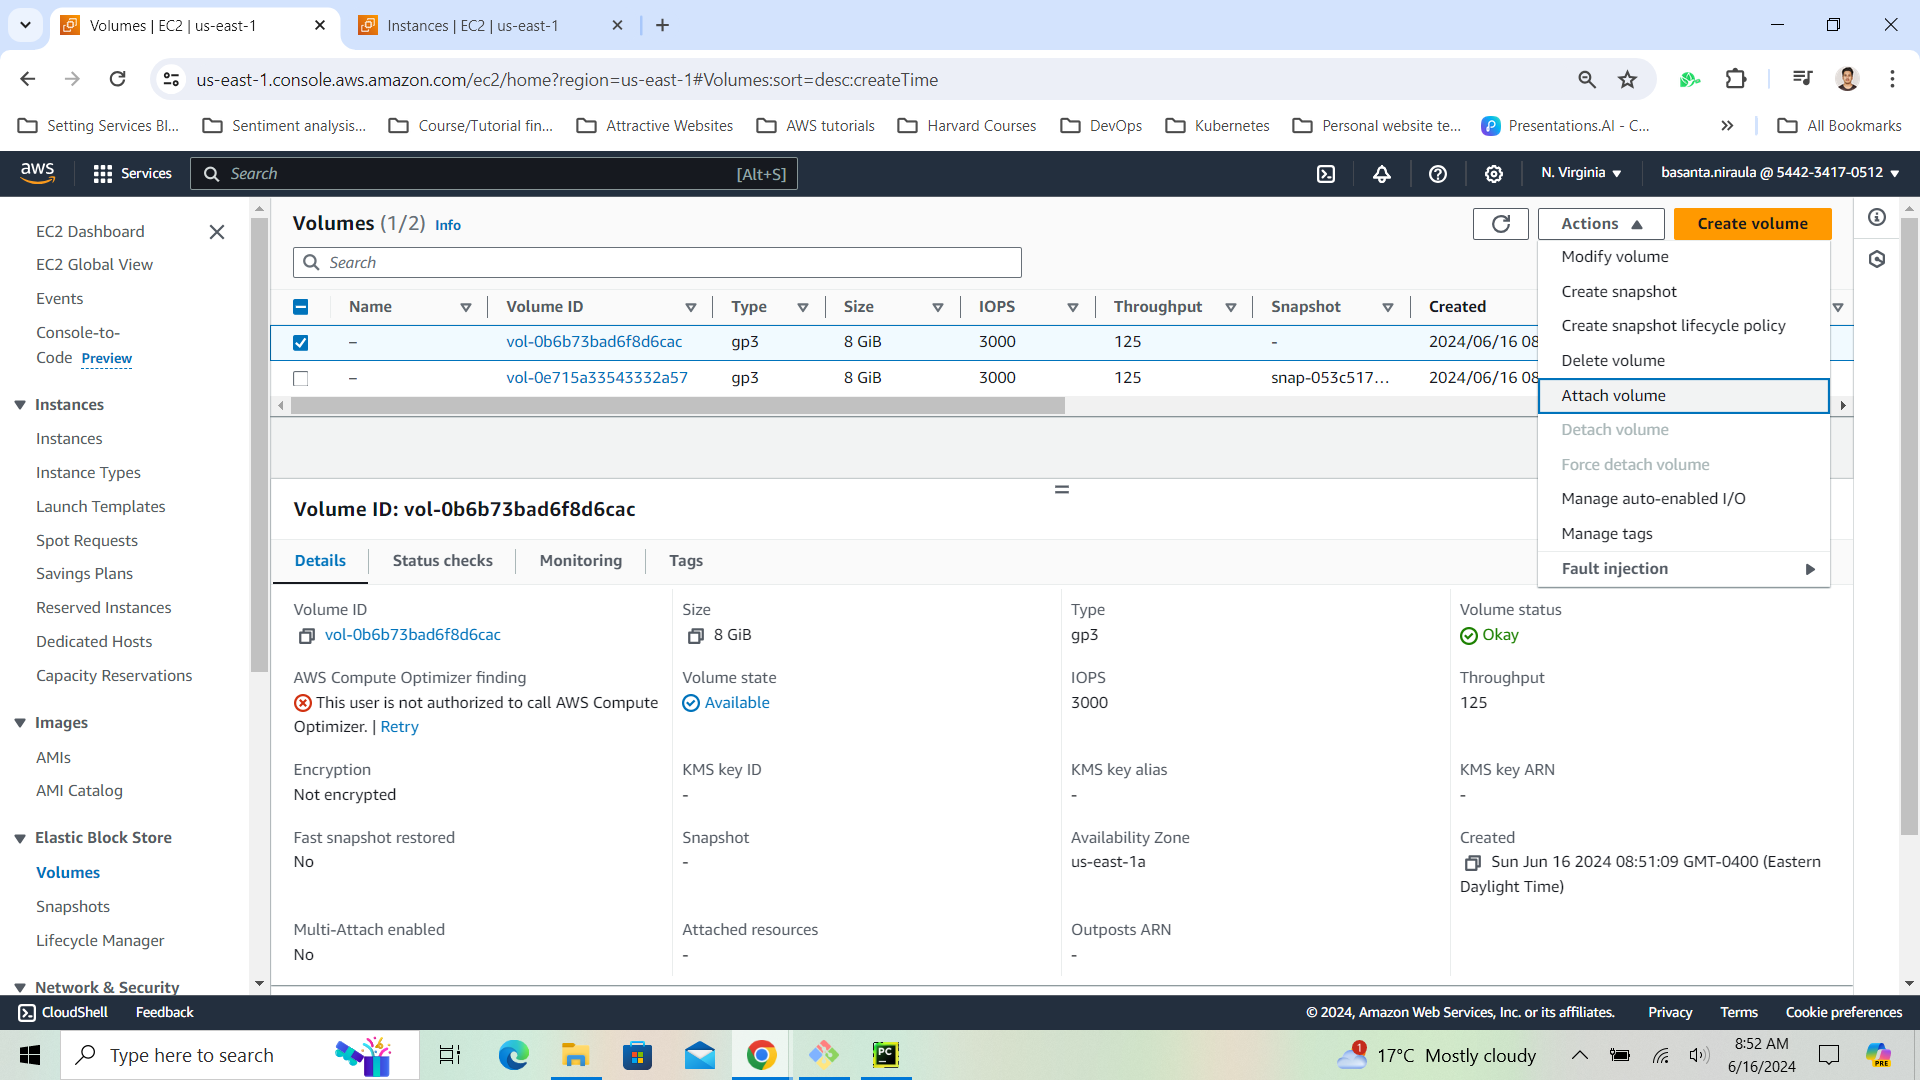
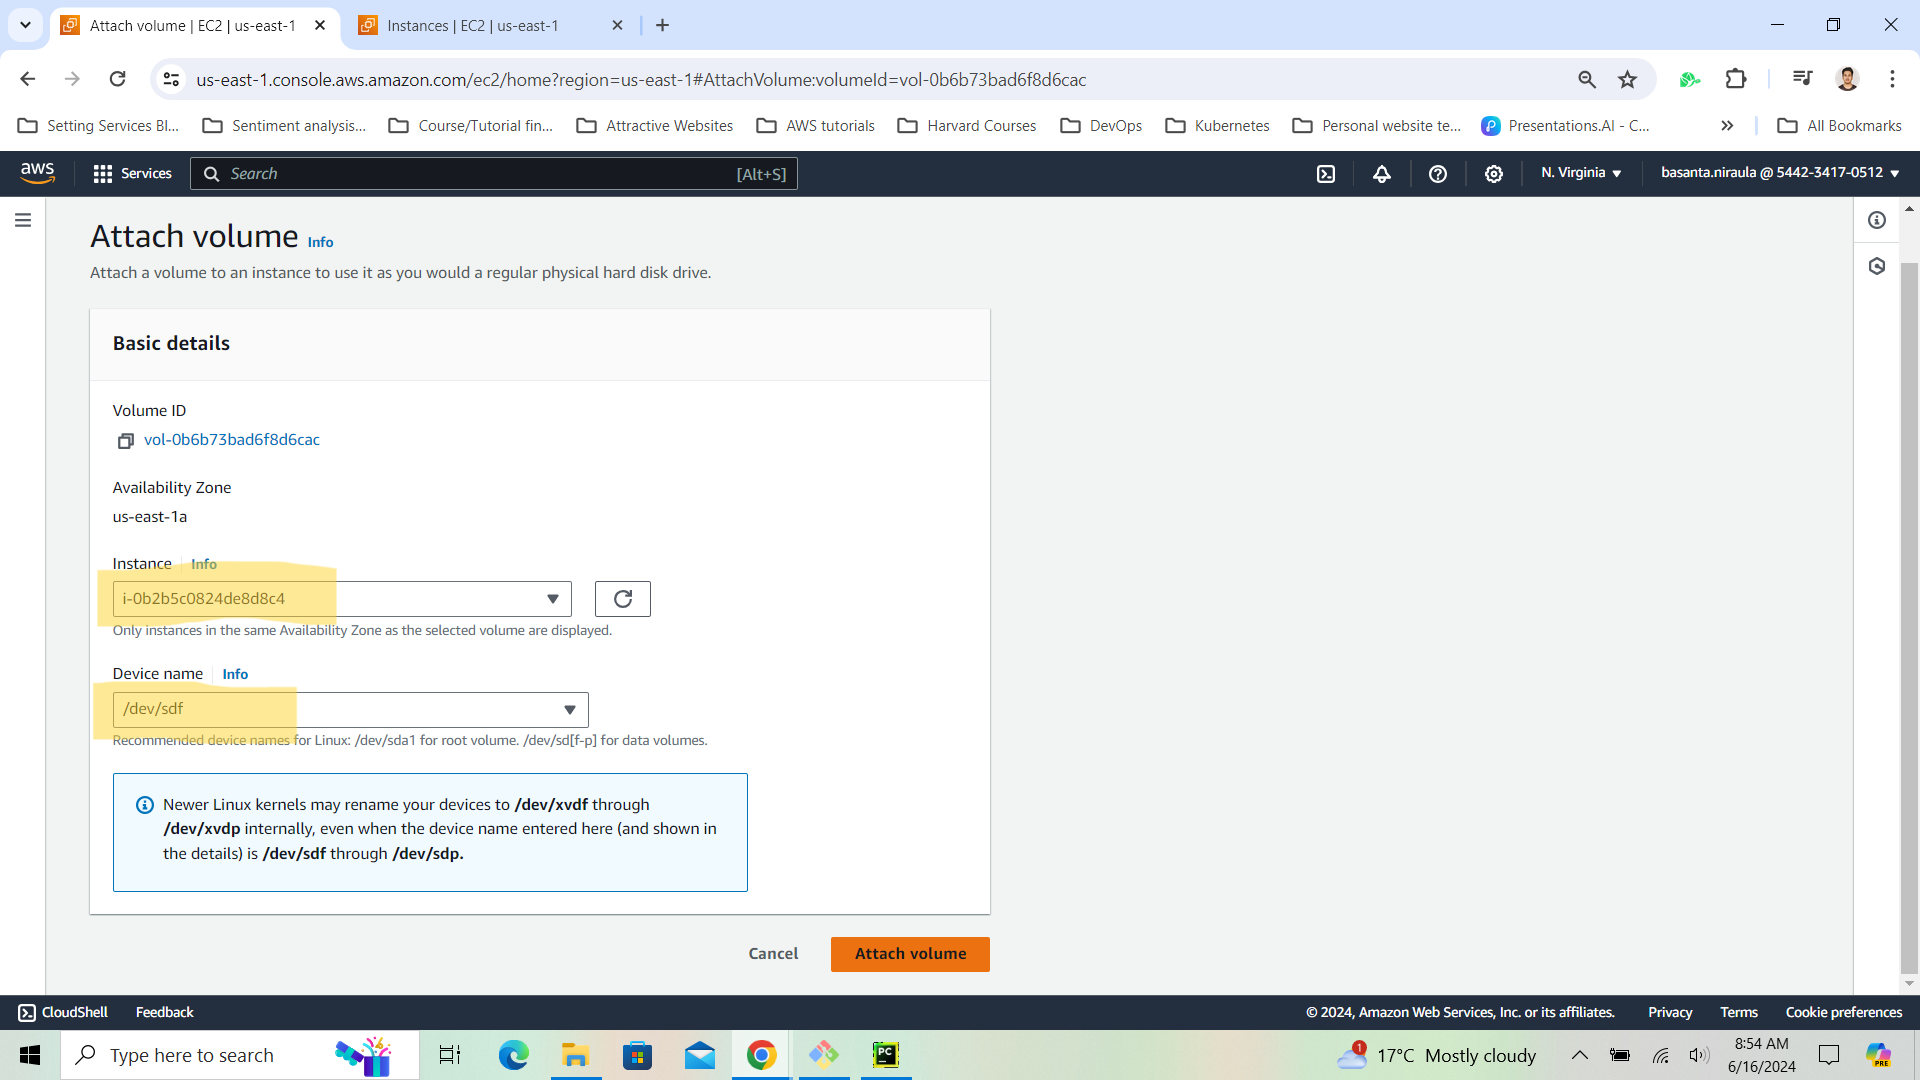
3. Verify the Volume Attachment
Run the following commands to see the changes:
sudo fdisk -l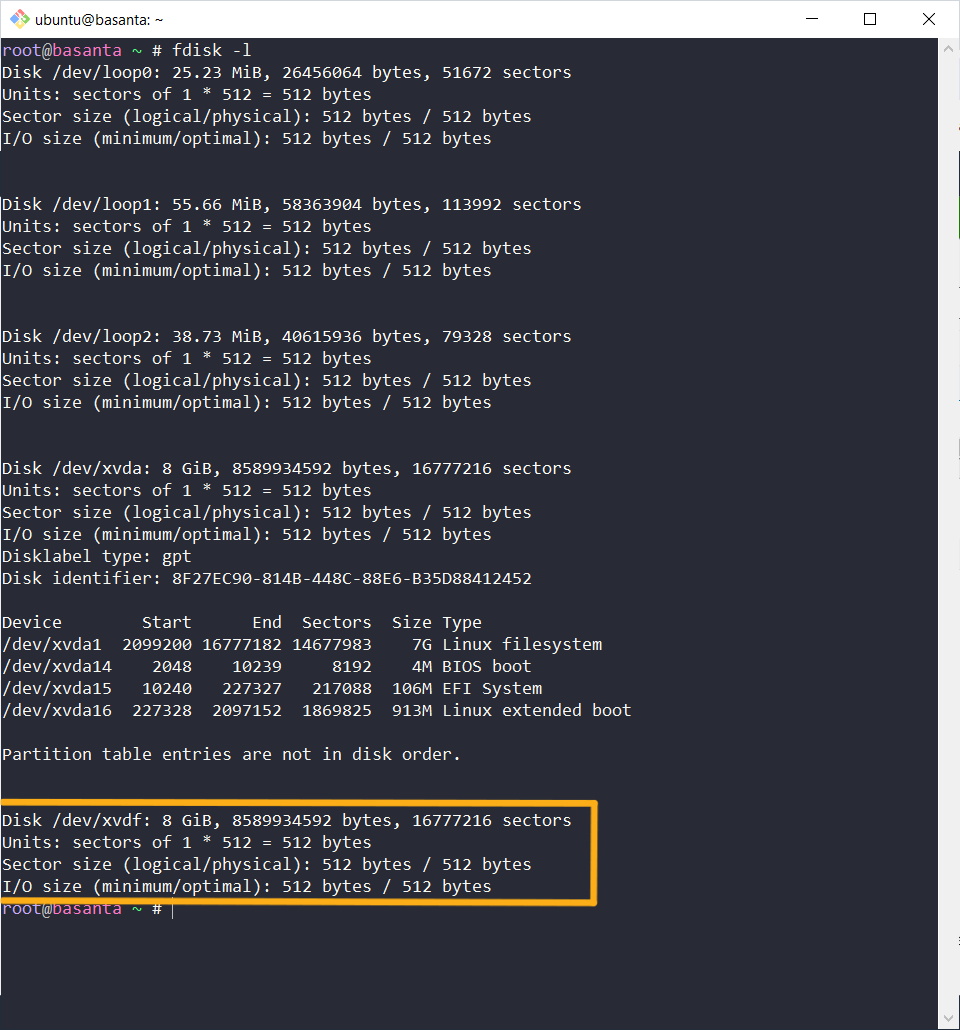
df -h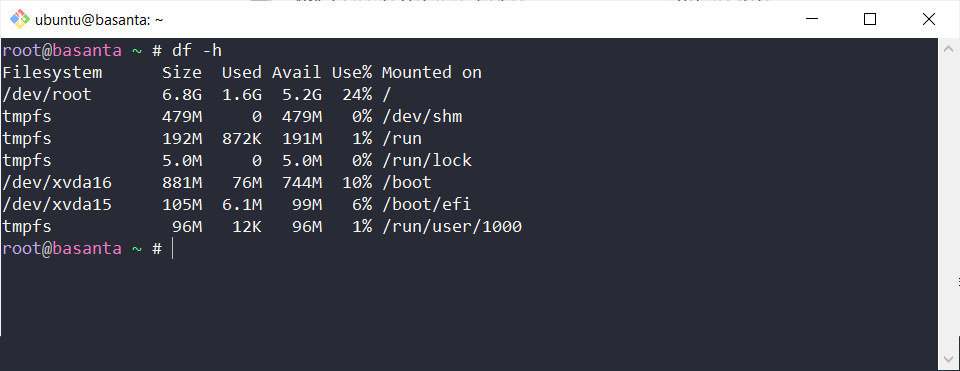
Since the disk is not mounted, it will not show up in the
df -hcommand.
lsblk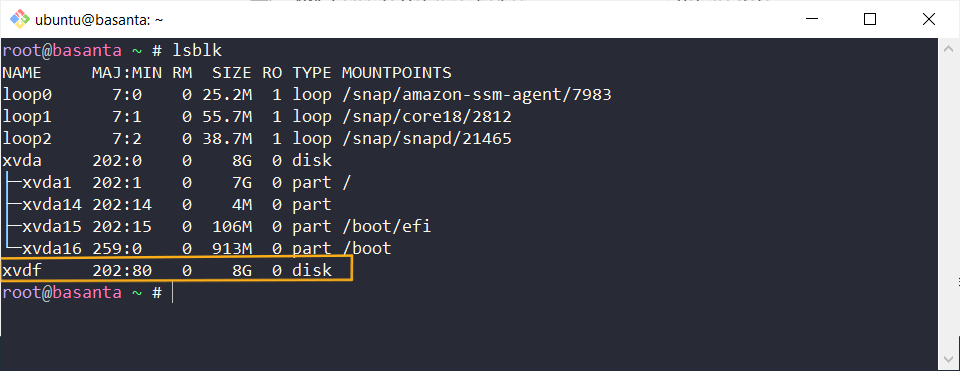
It will show the disk even though it is not mounted.
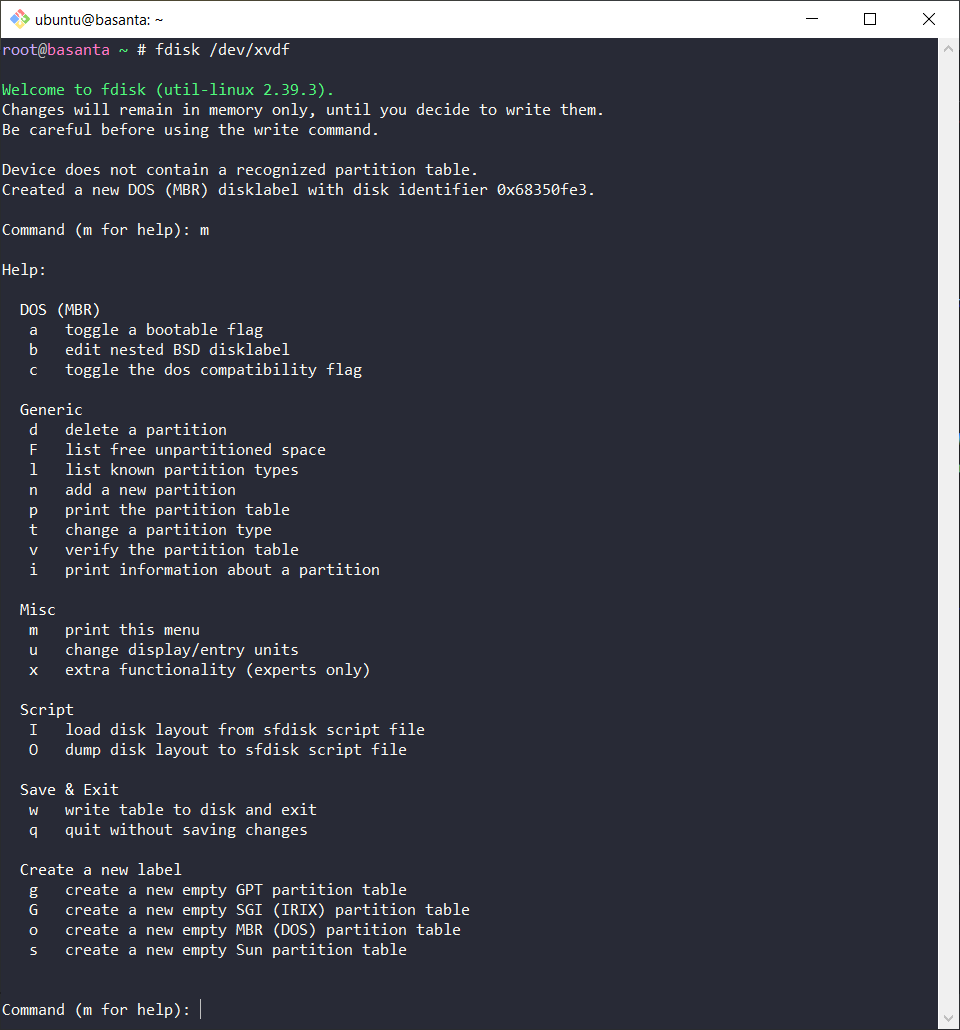
4. Create a Partition with fdisk
sudo fdisk [disk_path]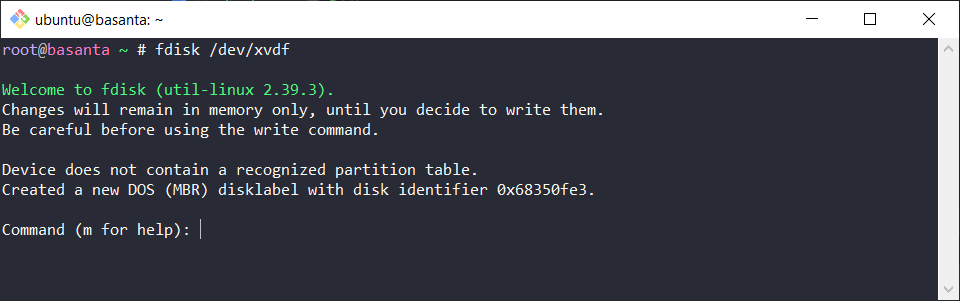
Use m for help:
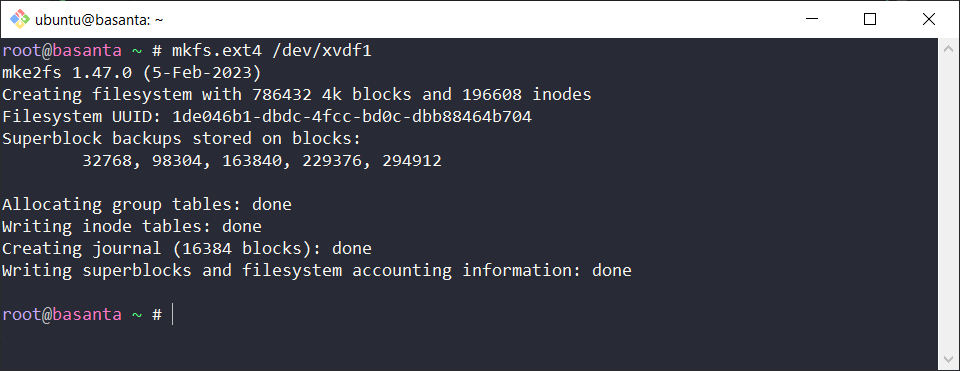
5. Format the Partition
The default Linux utility for formatting is mkfs:
sudo mkfs.ext4 [partition_path]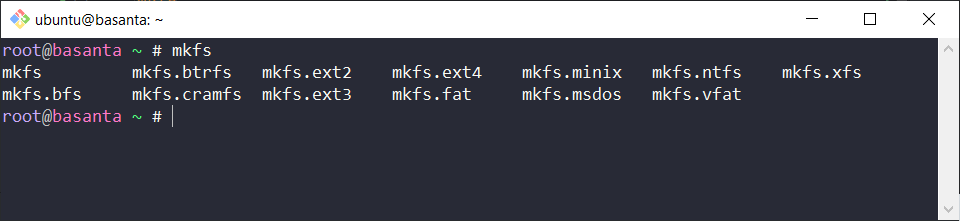
6. Mount the Partition (e.g., for MySQL Database Data)
[TOC] Create a mount point and mount the partition:
sudo mkdir /mnt/mysql-data
sudo mount [partition_path] /mnt/mysql-data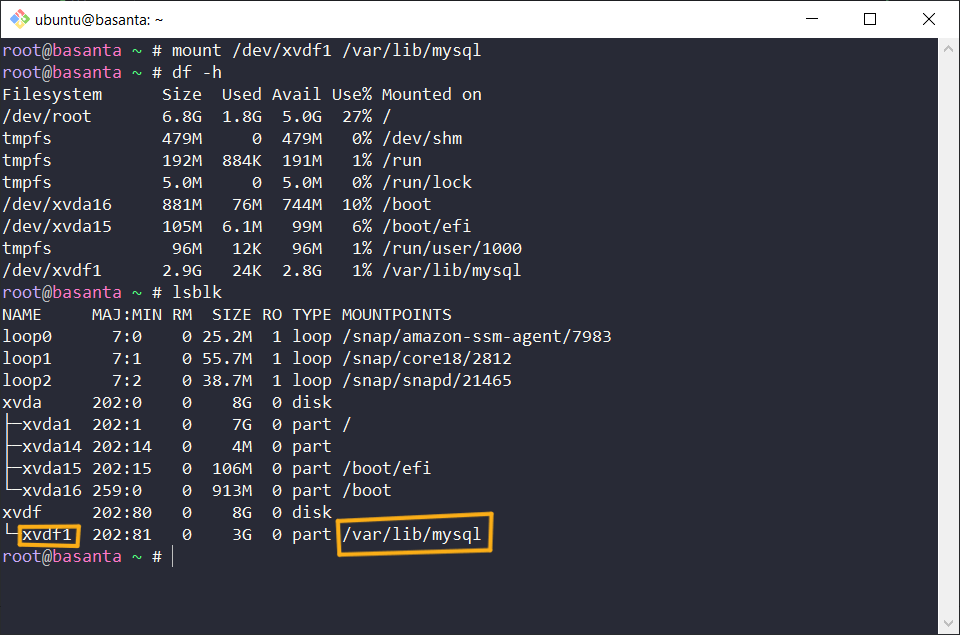
7. To Unmount the Partition
sudo umount /mnt/mysql-data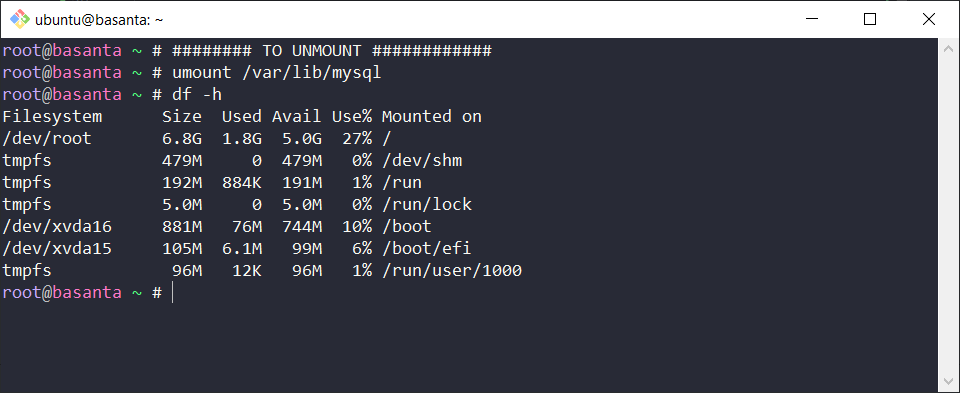
8. To Permanently Mount the Partition
-
Update the
/etc/fstabfile: Add the following line:[partition_path] /mnt/mysql-data ext4 defaults 0 0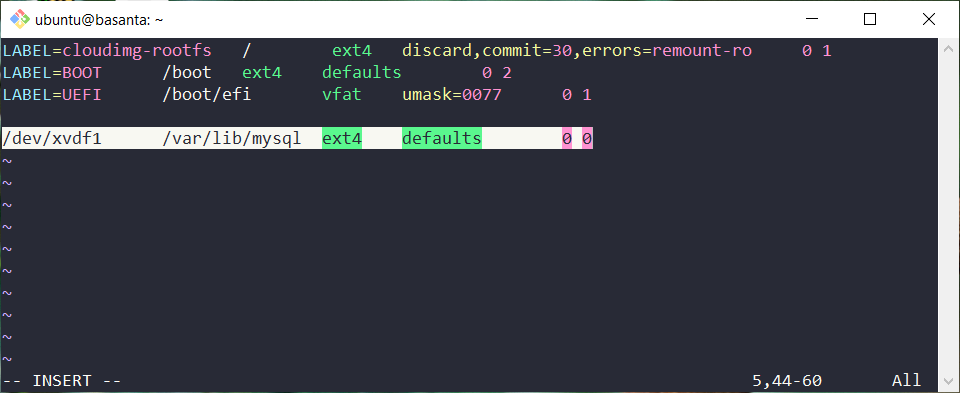
-
Mount from the
fstabfile:sudo mount -a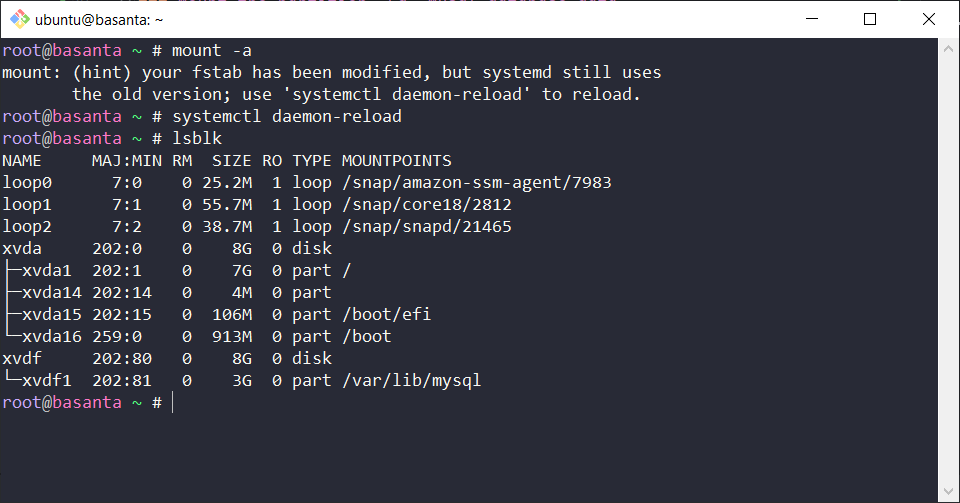
This will permanently mount the partition to the specified path.
Process Commands
1. Command: ps
- Description: Displays information about a selection of the active processes.
- Syntax:
ps [options] - Example Syntax:
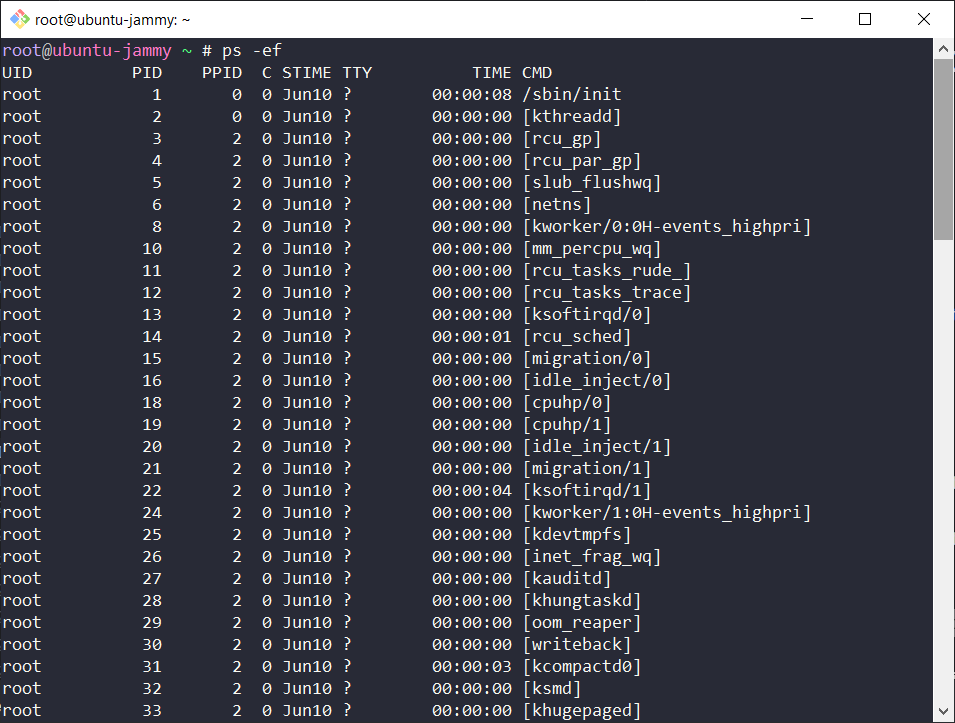
ps aux - Usage:
ps aux: Display information about all running processes.ps -ef: Display a full listing of processes.
- Options:
-a: Shows processes from all users.-u: Displays the user-oriented format.
- Output Columns:
PID: Process ID.USER: User who owns the process.COMMAND: Command or application associated with the process.%CPU: Percentage of CPU time used by the process.%MEM: Percentage of memory used by the process.STAT: Process status (e.g., running, sleeping, zombie).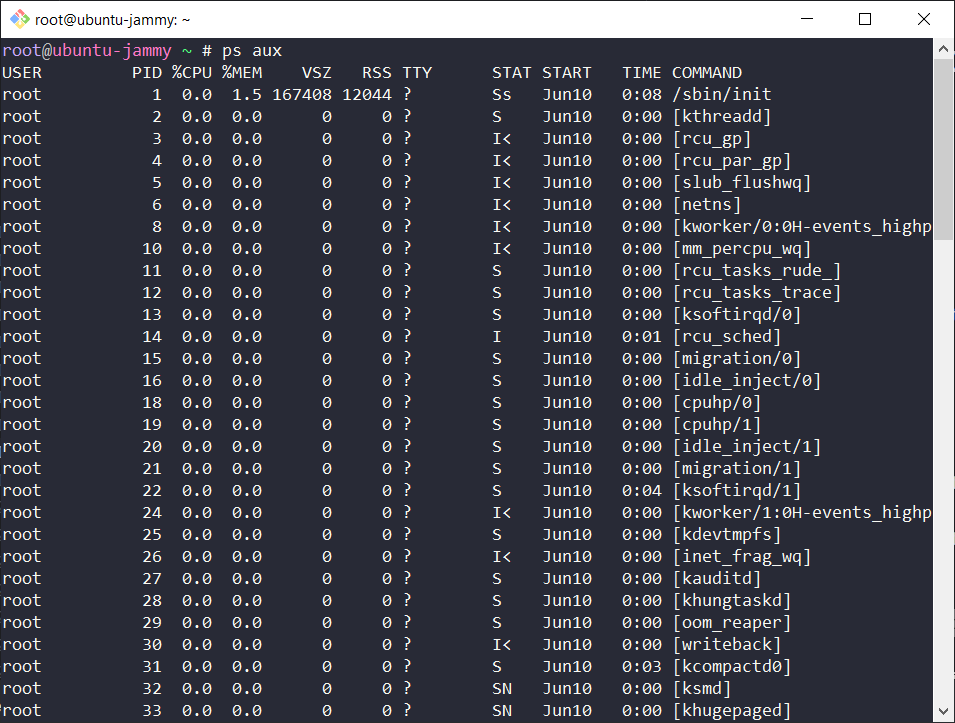
2. Command: top
- Description: Provides a
DYNAMIC / REAL_TIMEview of the running system. - Syntax:
top [options] - Example Syntax:
top - Usage:
top: Display a dynamic view of system processes.top -u <username>: Display processes for a specific user.
- Interactive Commands:
k: Kill a process.q: Quit top.1: Toggle between single and multiple CPU display.
- Output Columns:
PID: Process ID.USER: User who owns the process.PR: Priority of the process.NI: Nice value of the process.VIRT: Virtual memory used by the process.RES: Resident memory size.%CPU: Percentage of CPU time used by the process.%MEM: Percentage of memory used by the process.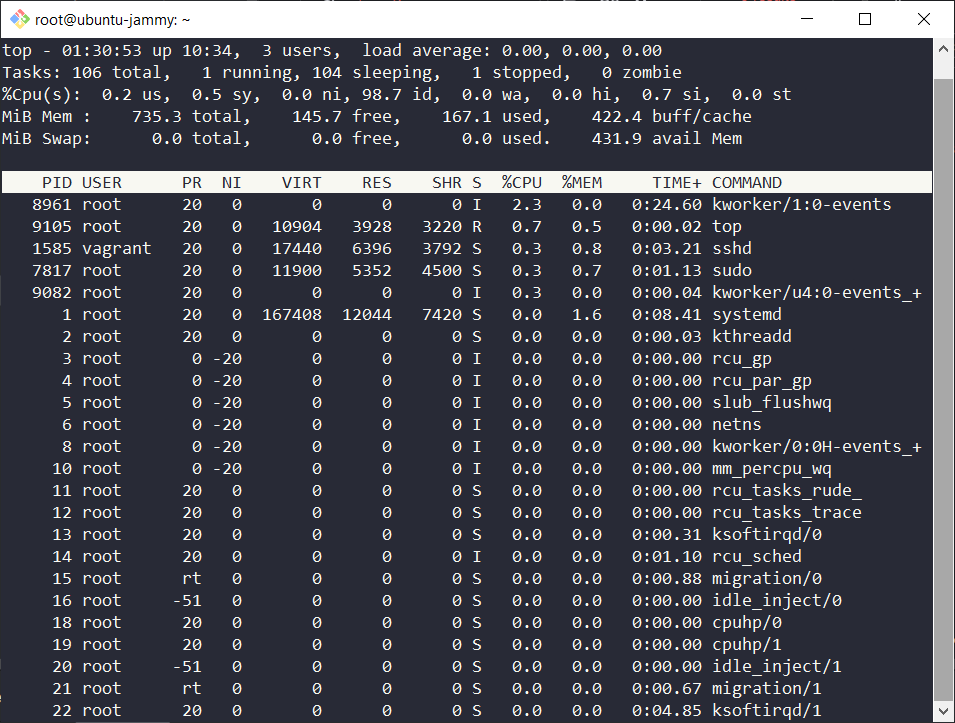
3. Command: kill
- Description: Terminates a process by its process ID (PID) or job ID.
- Syntax:
kill [options] <PID> - Example Syntax:
kill 1234 - Usage:
kill <PID>: Terminate a process by its PID.kill -9 <PID>: Forcefully terminate a process.
- Options:
-9: Sends a SIGKILL signal to the process, forcing termination.-15: Sends a SIGTERM signal to the process, allowing it to gracefully exit.
- Common Signals:
SIGKILL (9): Terminate immediately.SIGTERM (15): Terminate gracefully.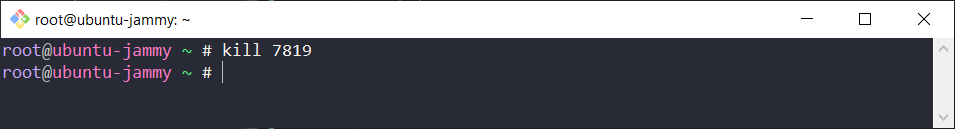
4. Command: killall
- Description: Kills processes by name rather than by process ID.
- Syntax:
killall [options] <process_name> - Example Syntax:
killall firefox - Usage:
killall <process_name>: Terminate all instances of a process by name.killall -9 <process_name>: Forcefully terminate all instances.
- Options:
-9: Sends a SIGKILL signal to the process, forcing termination.-u <username>: Terminate processes owned by a specific user.
5. Command: nice
- Description: Runs a program with modified scheduling priority.
- Syntax:
nice [options] <command> - Example Syntax:
nice -n 10 ./myprogram - Usage:
nice <command>: Run a command with a default nice value of 10.nice -n <value> <command>: Specify a custom nice value (range: -20 to 19).
- Options:
-n <value>: Set the nice value for the command.
6. Command: renice
- Description: Alters the scheduling priority of running processes.
- Syntax:
renice [options] <priority> <PID> - Example Syntax:
renice -n 10 -p 1234 - Usage:
renice <priority> <PID>: Change the priority of a running process.renice -n <value> -u <username>: Change the priority of processes owned by a user.
- Options:
-n <value>: Set the nice value for the process.-p <PID>: Specify the process ID.-u <username>: Specify the username.
7. Command: pgrep
- Description: Searches for processes based on their name and other attributes.
- Syntax:
pgrep [options] <pattern> - Example Syntax:
pgrep firefox - Usage:
pgrep <pattern>: Search for processes by name.pgrep -u <username>: Search for processes owned by a specific user.
- Options:
-u <username>: Limit search to processes owned by a user.-x: Match the whole process name.
8. Command: pkill
- Description: Sends signals to processes based on name and other attributes.
- Syntax:
pkill [options] <pattern> - Example Syntax:
pkill -9 firefox - Usage:
pkill <pattern>: Terminate processes by name.pkill -u <username>: Terminate processes owned by a specific user.
- Options:
-9: Send a SIGKILL signal to the processes.-u <username>: Limit the operation to processes owned by a user.